Download
1 / 15
150 likes | 151 Vues
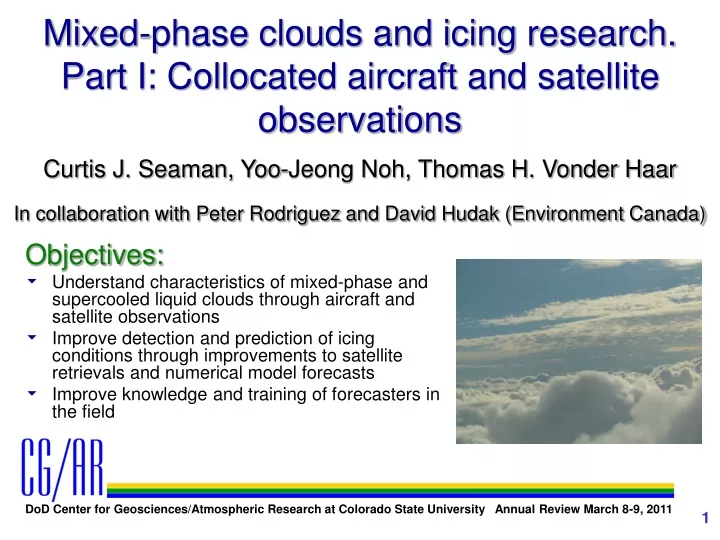
Mixed-phase clouds and icing research. Part I: Collocated aircraft and satellite observations. Curtis J. Seaman, Yoo-Jeong Noh, Thomas H. Vonder Haar In collaboration with Peter Rodriguez and David Hudak (Environment Canada). Objectives:

E N D
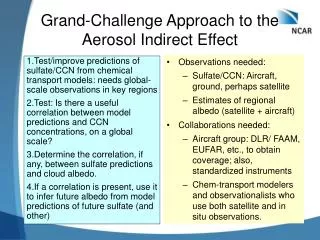
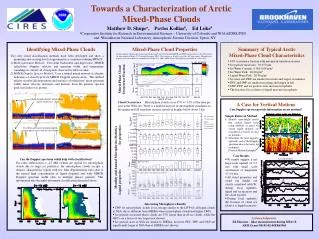
Mixed-phase clouds and icing research. Part I: Collocated aircraft and satellite observations Curtis J. Seaman, Yoo-Jeong Noh, Thomas H. Vonder Haar In collaboration with Peter Rodriguez and David Hudak (Environment Canada) Objectives: Understand characteristics of mixed-phase and supercooled liquid clouds through aircraft and satellite observations Improve detection and prediction of icing conditions through improvements to satellite retrievals and numerical model forecasts Improve knowledge and training of forecasters in the field
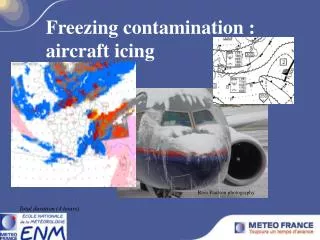
DoD Relevance: Mid-level clouds (altocumulus and altostratus) cover 20-30% of the Earth and often contain supercooled liquid water, which causes aircraft icing UAS/UAV have little to no de-icing capabilities They form at mission critical altitudes and impact pilot visibility, battlefield damage assessment, refueling, target detection, laser communication These clouds are difficult to forecast and can last 12+ hours
Mixed-phase clouds and icing research Deliverables: CG/AR Technical report: Vonder Haar, Noh, Seaman and Kankiewicz (2011): Synopsis of Mixed-phase Cloud Research and Results Journal paper: Noh, Seaman, Vonder Haar, Hudak and Rodriguez (2011): Comparisons and analyses of aircraft and satellite observations for wintertime, mixed-phase clouds. Journal of Geophysical Research, in revision. Conference papers/posters: BACIMO, Omaha, NE, 13-15 April 2010 IGARSS, Honolulu, HI, 25-30 July 2010
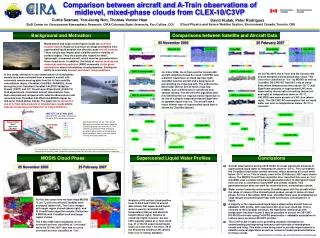
CloudSat Convair-580 Mixed-phase clouds and icing research CLEX-10: Extensive field campaign in collaboration with the Canadian CloudSat/CALIPSO Validation Project (C3VP) 31 October 2006 – 1 March 2007 28 flights totaling 107 hours (CG/AR funded ~20%) Collocated CloudSat / CALIPSO (A-Train) and aircraft measurements, often in mixed-phase clouds ~1828 UTC on 05 Nov 2006 Aqua MODIS: Cloud top temperature CloudSat CPR reflectivity and cloud classification
MODIS Cloud Phase 31 Oct 2006 5 Nov 2006 25 Feb 2007 • Research aircraft was flown through clouds Aqua MODIS classified as “uncertain”, “mixed-phase” or “ice” • All three cases were “mixed-phase” • 31 Oct and 5 Nov had patchy thin cirrus overhead
31 October 2006 No liquid below -20 oC in CloudSat Supercooled liquid at -23 oC Gray shading = CloudSat Cloud Mask
5 November 2006 Cloud Mask and Cloud Water Content don’t always agree Supercooled liquid and icing! Gray shading = CloudSat Cloud Mask
5 November 2006 Image: Kevin Strawbridge, EC • King and Nevzorov probes detected ~500 m thick cloud layer • 2D optical array probes not functional on this flight • CloudSat detected ~ 2 km thick cloud • Could this be due to precipitating ice virga (detected by lidar at CARE)? If so, CloudSat assumes it is liquid
25 February 2007 Supercooled liquid at -28 oC that CloudSat flags as ice Average IWC derived from 2D optical array probes using three different methods Gray shading = CloudSat Cloud Mask
ECMWF-AUX products Temperature errors ~2-3 oC Pressure errors ~ 10 mb 31 Oct 2006 5 Nov 2006 25 Feb 2007
Conclusions NCEP GFS Model Water Distribution -40 -30 -20 -10 0 10 Cloud Water (Observed) Cloud Water (Model-Fletcher) o Temperature ( C) 20 0 0.5 1 Water Fraction • CloudSat uses the same assumptions about cloud phase that many (most?) models use • CloudSat puts the IWC at cloud top, LWC at cloud base for clouds at -20 oC • Will assume ice virga is liquid in temperatures above -20 oC • Magnitudes of LWC, IWC from CloudSat are generally within the error of the aircraft measurements • Cloud Mask and CWC retrieval don’t necessarily agree on cloud boundaries • Technical report complete
31 October 2006 CloudSat CPR • CloudSat correctly classified this cloud as altostratus • Differences in aircraft vs. CloudSat radar are evident • At the time of the CloudSat overpass, the aircraft was 214 m from the sub-satellite point! Convair Ka-band
5 November 2006 CloudSat CPR • CloudSat correctly classified this cloud as altocumulus • CloudSat saw the aircraft! • At the time of the CloudSat overpass, the aircraft was 356 m from the sub-satellite point Convair Ka-band
25 February 2007 CloudSat CPR • MODIS classified cloud as “ice”, yet had significant supercooled liquid • CloudSat correctly classified this cloud as altostratus • Gap in CloudSat data due to signal contamination with airborne W-band radar • At the time of the CloudSat overpass, the aircraft was 111 m from the sub-satellite point! Convair Ka-band
Effective Radius 31 Oct 2006 5 Nov 2006 25 Feb 2007 • Liquid droplet effective radius from CloudSat shows general agreement with FSSP effective radius