Download
1 / 15
150 likes | 300 Vues
YVPVSL C ( fgly ) TPSRAAL (45-58)( C51 as fgly ) Theoretical monoisotopic mass = 729.9012 (2+). Figure S1A. NL:. 7.73E8. 729.9020. 2+. Precursor ion. 100. 90. 730.4028. 80. 70. 60. Relative Abundance. 50. 730.9041. 40. 30. 731.4056. 20. 731.9074. 10. 0. 1+. 729.0.

E N D
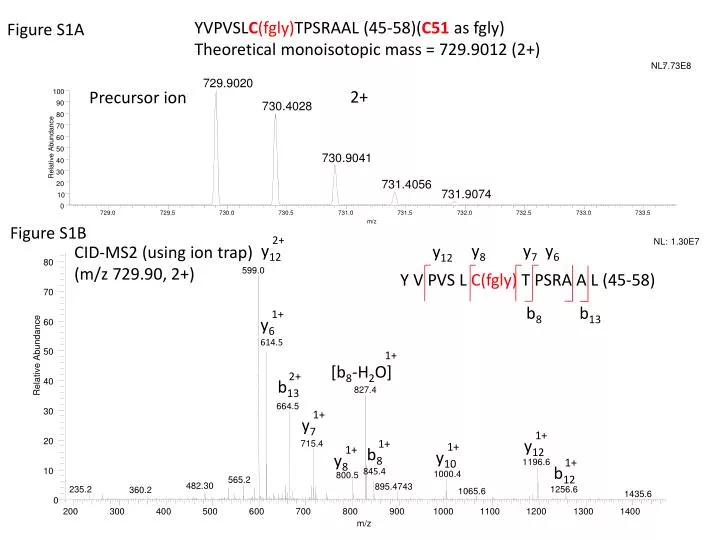
YVPVSLC(fgly)TPSRAAL (45-58)(C51 as fgly) Theoretical monoisotopic mass = 729.9012 (2+) Figure S1A NL: 7.73E8 729.9020 2+ Precursor ion 100 90 730.4028 80 70 60 Relative Abundance 50 730.9041 40 30 731.4056 20 731.9074 10 0 1+ 729.0 729.5 730.0 730.5 731.0 731.5 732.0 732.5 733.0 733.5 1+ 1+ 1+ 1+ 2+ 1+ 1+ 2+ 1+ y12 y6 y7 y8 y12 b13 b12 b8 [b8-H2O] y10 m/z Figure S1B CID-MS2 (using ion trap) (m/z 729.90, 2+) NL: 1.30E7 y8 y7 y6 y12 80 599.0 Y V PVS L C(fgly) T PSRA A L (45-58) 70 b8 b13 60 614.5 Relative Abundance 50 40 827.4 664.5 30 20 715.4 1196.6 845.4 10 1000.4 800.5 565.2 482.30 895.4743 235.2 1256.6 360.2 1065.6 1435.6 0 200 300 400 500 600 700 800 900 1000 1100 1200 1300 1400 m/z
YVPVSLCTPSRAAL (45-58)(C51 as free cys) Theoretical monoisotopic mass = 738.8976 (2+) Figure S2A Precursor ion NL: 3.19E7 738.9059 2+ 100 90 739.4073 80 70 60 Relative Abundance 50 739.9084 40 30 740.4108 20 y12 y6 10 0 738.0 738.5 739.0 739.5 740.0 740.5 741.0 741.5 742.0 742.5 743.0 YVPV SLCT PSRAA L (45-58) m/z NL: 4.67E5 Figure S2B 2+ 729.9 [M-H2O] 100 b8 b2 CID-MS2 (using ion trap) (m/z 738.90, 2+) 90 80 70 60 2+ Relative Abundance 50 [M-SH2] 1+ y6 2+ b13 40 1+ [b8-2H2O] 30 2+ [y12-H2O] 614.5 1+ [y12-H2O] 1+ [y10-H2O] 2+ 20 1+ b2 [M-SCH2] 2+ 827.3 [b12-H2O] 1+ b4 10 1196.6 1000.6 460.2 893.9 380.2 1309.7 263.3 1418.9 0 200 300 400 500 600 700 800 900 1000 1100 1200 1300 1400 m/z
Figure S3A RMSRGGCSGL (270-279)(C276 as free cys) Theoretical monoisotopic mass = 512.2448 (2+) Precursor ion NL: 2.92E7 512.2453 100 2+ 90 80 70 60 512.7463 Relative Abundance 50 40 30 513.2459 20 513.7459 10 [M-H2O] [M-SCH2] 2+ 2+ 0 100 511.8 512.0 512.2 512.4 512.6 512.8 513.0 513.2 513.4 513.6 513.8 514.0 514.2 514.4 514.6 Figure S3B m/z NL: 1.10E6 456.0 90 CID-MS2 (using ion trap) (m/z 512.22, 2+) y9 1+ 1+ 1+ 2+ 2+ 2+ 2+ 1+ 1+ 1+ [b7-H2O] [b6-H2O] [b8-H2O] c9 b8 b4 b4 b3 b9 y9 80 R MS R GG C S G L (270-279) 503.7 b3 70 60 Relative Abundance 50 40 30 20 447.0 10 867.5 964.5 488.3 818.2 731.2 875.5 396.1 531.2 266.6 628.3 358.6 189.1 835.5 800.3 947.3 704.5 323.2 893.9 600.1 1027.7 0 200 300 400 500 600 700 800 900 1000 m/z
y13 y5 LRCGKGTTYEGGVRE (P1) (280-294) (C282) FTQGSAHSDTTADPACHASSSL(P2)(381-402) (C396) b5 y9 y19 b10 b18 b9 Theoretical monoisotopic mass = 1271.9117 (3+) Figure S4A Precursor ion 1272.5826 NL: 1.07E8 3+ 100 1272.2495 1272.9169 80 1273.2507 60 1271.9153 Relative Abundance 40 Monoisotopic mass 1273.5851 20 1273.9186 0 1270.0 1271.0 1272.0 1273.0 1274.0 1275.0 m/z Figure S4B y92+(P2) NL: 2.76E5 CID-MS2 (using ion trap) (m/z 1272.58, 3+) 1248.8 100 b13 1+(P2) [y9-H2O]2+(P2) 90 y132+(P2) 1320.9 1239.8 80 1443.0 70 y162+(P2) 60 [b11-2H2O]4+(P1) b18 3+(P2) y142+(P2) Relative Abundance 1612.8 50 b9 1+(P2) 1142.0 b10 2+(P1) 829.9 40 y51+(P1) y133+(P1) 931.7 1650.3 30 y152+(P2) 1184.1 b5 2+(P1) y192+(P2) [y16-H2O]3+(P2) 20 1544.0 1068.7 517.6 787.9 1375.2 1501.3 1720.1 10 1980.7 0 400 500 600 700 800 900 1000 1100 1200 1300 1400 1500 1600 1700 1800 1900 2000 m/z x5 x5
Figure S4C z5 z8 LRCGKGTTYEGGVRE (P1) (280-294) (C282) FTQGSAHSDTTADPACHASSSL(P2)(381-402) (C396) c7 ETD-MS2 (using ion trap) (m/z 764.95, 5+) c14 z10 z20 c2 c7 NL: 9.16E5 [M]2+ · · · 1909.0 100 [P1]2+ 90 [M-NH3]2+ · · · 813.8 80 1901.1 [M-H2O]3+ · · Z202+(P2) 70 [P2]2+ 1267.4 60 1777.5 1097.0 Relative Abundance C142+(P1) Z203+(P2) Z182+(P2) 50 C4 1+(P2) 40 1684.5 451.3 Z81+(P1) Z102+(P2) C7 1+(P2) Z192+(P2) 30 1626.1 C7 2+(P1) Z51+(P1) Z61+(P1) C3 1+(P2) Z143+(P2) 1122.4 C2 1+(P2) 1843.9 894.5 1298.5 20 746.5 1184.9 1711.8 502.4 1462.2 394.3 630.3 1594.8 995.5 266.2 1341.8 10 0 m/z 200 400 600 800 1000 1200 1400 1600 1800 2000 x2
Figure S5 Nested Disulfides with Correct and Scrambled Configurations in a Tryptic Peptide A (correct) C138 C143 C150 C154 FLGIPYSHDQGPCQNLTCFPPATPCDGGCDQGLVPIPLLANLSVEAQPPWLPGLEAR B (scramble 1) C138 C143 C150 C154 FLGIPYSHDQGPCQNLTCFPPATPCDGGCDQGLVPIPLLANLSVEAQPPWLPGLEAR C (scramble 2) C138 C143 C150 C154 FLGIPYSHDQGPCQNLTCFPPATPCDGGCDQGLVPIPLLANLSVEAQPPWLPGLEAR
Digestion Strategy for Nested Disulfides Figure S6 A (Lys-C + trypsin) C138 C143 C150 C154 FLGIPYSHDQGPCQNLTCFPPATPCDGGCDQGLVPIPLLANLSVEAQPPWLPGLEAR B (Lys-C + trypsin + PNGase F) C138 C143 C150 C154 FLGIPYSHDQGPCQDLTCFPPATPCDGGCDQGLVPIPLLADLSVEAQPPWLPGLEAR C (Lys-C + trypsin + PNGaseF + Asp-N) C138 C143 C150 C154 FLGIPYSH DQGPCQ DLTCFPPATPCDGGC DQGLVPIPLLA DLSVEAQPPWLPGLEAR
Digestion Strategy for Nested Disulfides Figure S7 Lys-C + trypsin + PNGaseF + Asp-N C138 C143 C150 C154 FLGIPYSH DQGPCQ DLTCFPPATPCDGGC DQGLVPIPLLA DLSVEAQPPWLPGLEAR C138 C143 C150 C154 DQGPCQ DLTCFPPATPCDGGC C138 DQGPCQ C143 C150 DLTCFPPATPCDGGC C154
100 90 80 70 60 Relative Abundance 50 40 30 20 10 0 200 400 600 800 1000 1200 1400 1600 1800 2000 m/z Figure S8 ETD-MS2 (using ion trap) (m/z 713.90, 3+) NL: 7.67E3 [M+3H]3+ 714.5 • DQGPCQ (p1) (134-139)D L T CFPPATPCD GGC(p2) (140-154) [M+3H]2+• P1 1+ P2 1+ 1070.6 1494.9 1426.1 647.4 1782.8 1368.8 915.5 1225.5 842.6 1881.5 283.3 429.4 517.2 202.2 1590.8
A Scrambled Disulfide Figure S9A y10 y6 DQGPCQDLTCF P PA T PCDGGC (134-154) (C138-C143, C150-C154) b11 b15 Enzyme digestion: Lys-C + Trypsin + PNGase F + Asp-N at pH8 Precursor ion, 2+ CID-MS2 (using Orbitrap) (m/z 1061.40, 2+) 915.3339 z=1 100 1+ 1+ 1+ 1+ 1+ 1+ 1+ 1+ b12 y9 b15 y7 y10 b11 y6 b14 1043.3848 90 650.1906 z=2 z=1 1206.4578 549.1428 z=1 80 z=1 70 1471.6019 z=1 1572.6499 z=1 60 818.2810 Theoretical monoisotopic mass = 1060.8955 (2+) 1061.3990 1060.8974 Relative Abundance 100 50 1061.8992 871.4703 80 40 z=1 699.3681 60 Relative Abundance z=1 1062.3996 30 503.0838 40 z=? 1062.905 376.7184 20 20 z=8 1754.5939 1130.8780 1436.4742 777.9993 z=1 z=? z=1 1858.2398 0 z=? 1622.5437 10 z=? 1303.5108 1061.0 1062.0 1063.0 1064.0 z=1 m/z z=1 1974.7286 z=1 0 400 600 800 1000 1200 1400 1600 1800 2000 m/z
Chromatographic Retention Times for Correct and Scrambled Disulfides Figure S9B DQGPCQDLTCFPPATPCDGGC (134-154) Correct Scrambled 48.79 53.94 100 DQGPCQ (p1) (134-139)D L T CFPPATPCD GGC(p2) (140-154) 80 Relative Abundance 60 40 20 0 30 40 50 60 70 Time (min)
Nested Disulfide (pepsin digestion) y6 y3 Figure S10 HRFLGIPYSHDQGPCQNLTCFPPATPCDGGCDQGLVPIPLL (124-164) (C138-C154, C143-C150) b6 b40 HRFLGIPYSHDQGPCQNLTCFPPATPCDGGCDQGLVPIPLL Precursor ion, 4+ Theoretical monoisotopic mass = 1094.0161 (4+) 1345.1 1094.5201 NL: 2.17E5 1094.7703 100 Enzyme digestion: pepsin at pH 2 (since the N-linked site is not fully glycosylated, a non-glycosylated counterpart was selected for interpretation) 1275.3 1415.4 100 1094.2699 80 1095.0205 60 1095.2712 80 1094.0192 40 Relative Abundance 1095.5216 1095.7723 20 60 CID-MS2 (using ion trap) (m/z 1094.52, 4+) 0 1033.5 1092.0 1093.0 1094.0 1095.0 1096.0 1097.0 Relative Abundance m/z 342.3 40 1061.6 b38 3+ b36 3+ b403+ 980.9 1713.6 20 552.3 662.4 1903.8 1242.4 724.8 1769.5 0 b38 4+ 300 400 500 600 700 800 900 1000 1100 1200 1300 1400 1500 1600 1700 1800 1900 2000 b39 4+ m/z y31+ 1009.2 b404+ b37 4+ b32 2+ b35 2+ y51+ b11 2+ b35 3+ 1863.1 b6 1+ x20 x5 x20 x5
Figure S11 Precursor ion • PALQICCHPGCTPRPACCHCPDPHA (465-489) (C470-C482, C471-C484, and C475-C481) Theoretical monoisotopic mass = 874.3564 (3+) NL: 1.01E8 874.6909 3+ 100 875.0243 90 874.3569 80 875.3581 70 60 Relative Abundance 50 875.6916 40 30 876.0251 20 876.3585 10 0 873.5 874.0 874.5 875.0 875.5 876.0 876.5 877.0 877.5 878.0 m/z
Figure S12 100 90 80 70 60 Relative Abundance 50 40 30 20 10 0 m/z CID-MS2 (m/z 874.69, 3+) NL: 6.58E6 y21 y3 1149.7 PALQ ICCHPGCTPRPACCHCPD PH A (465-489) b20 b22 1+ 1+ 3+ 2+ 2+ 2+ b5 b20 b22 b24 y21 y3 1106.8 324.2 845.1 1043.7 786.3 1227.6 1775.5 523.4 655.4 1462.1 1637.5 1888.6 400 600 800 1000 1200 1400 1600 1800 2000
Figure S13 100 90 80 70 60 Relative Abundance 50 40 30 20 10 0 CID-MS3 (using ion trap) m/z 656.60 (ETD)→1312.6 (CID-MS3) S· SH y17 y5 PA L Q I CCH PG CTPRPAC CH CPD PHA (465-489) b17 b22 b8 S· SH NL: 3.12E5 b22 2+ x50 x20 x50 1150.8 y171+ b20 2+ [Internal cleavage of y17 and y3] 1+ 1760.0 1044.8 b191+ y5 1+ b8 1+ [M-SH2]2+ 1+ b17+S z14 1+ 1436.8 1985.2 536.4 c18 1+ 1295.1 z15 1+ 864.6 y6 1+ z5 1+ y7 1+ 1485.8 b24 2+ 1676.8 947.9 1588.9 b7 1+ 1864.0 521.4 639.4 1403.9 830.6 b4 1+ z6 1+ 1267.8 727.5 400 600 800 1000 1200 1400 1600 1800 2000 y151+ [b8-SH2]1+ b181+ m/z [Internal cleavage of y17 and y3-SH] 1+