Download
1 / 8
80 likes | 85 Vues
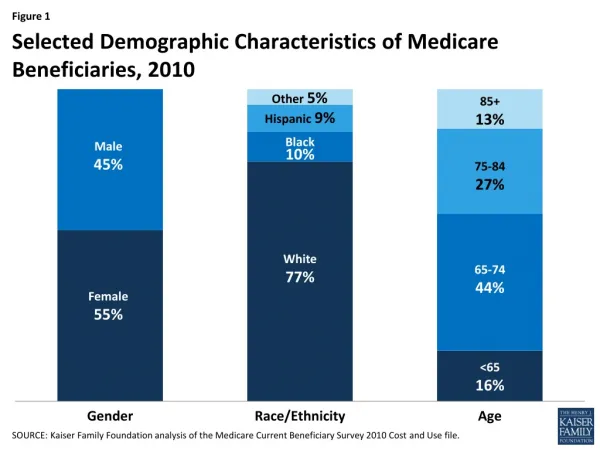
This study analyzes the relationship between age, race, region, and poverty levels in the US. The data examines the percentages and amounts of individuals living below the poverty level based on their characteristics such as sex, age group, race, and region.

E N D
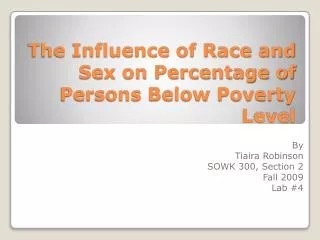
Persons Below Poverty Level By Selected Characteristics: 2005 By Bradford Martin
Value Variables • Sex • Age • Race • Region • Poverty Level • Male and Female • Under 18 Years Old- 55 Years and Older. • African American, White, Asian, & Hispanic. • Northeast, Midwest, South &West. • Percentages and Amount Per 1000.
The Hypothesis & Rationale • Hypothesis • Bivariate: The region and age of a person can make his or her likelihood of being below poverty higher or lower. • Multivariate: The relationship between a persons region, age, race and his or her poverty level are similar to the bivariate relationship for each race, but will be higher for Blacks for Whites. Being Black increases the chances of being raised and living in a below poverty environment. • Rationale • Each region and age group has a consistent pattern that matches the individuals of their set. The South had the highest percentage of below poverty individuals which could be the cause of a lower cost of living. The regions play a big role in influencing the poverty level by the jobs provided and cost of living. Age also helps determine the poverty level as indicated by the previous graphs because the age of a person determines whether he is a part of the working class of society or the non working class of society. The individuals who are not a part of the working class many times fall into the category of retired or too young to work. • A bigger trend amongst groups that are listed are the trends found in the different races. Blacks consistently held the highest below poverty levels regardless of region or age. Hispanics were close behind Blacks with dependable below poverty levels in each characteristic. Many Hispanics are new to the Nation and are settling in very slowly as it relates to economics. Blacks, many times lack the proper tools in their communities to become economically stable or achieve a status outside of which they were born. Race therefore supercedes each of the other categories when considering which factor plays the biggest role in a below poverty environment. • Hyperlinks • My Extra Credit Website • My Slideshow
Casual Models • Bivariate • Multivariate Race Race Below Poverty Level Region & Race Below Poverty
Bivariate Table #1 Persons Below Poverty Level by Selected Characteristics: 2005 ______________________________________________________ Age Groups _____________________________________ Races Under 18 y.o. 18-24 y.o. 25-34 y.o. 35-44 y.o. 45-54 y.o. 54+ Totals ______________________________________________________ White 14.4 16.1 10.8 8.6 6.7 23.6 80.1 Black 34.5 28.1 22.4 16.6 16.7 63.2 181.2 Asian 11.1 20.8 12.0 7.8 9.7 28.1 89.5 Hispanic 28.3 23.2 19.2 18.3 12.8 51.4 153.2 Totals 88.3 88.2 64.4 51.3 45.9 166.4 504.2 ______________________________________________________ Source: U.S. Census Bureau, 2005-2006
Multivariate Table #2 Persons Below Poverty Level by Selected Characteristics: 2005 ________________________________________________________________________________________________________ Age Groups _______________________________________________________________________________________ Races Under 18 y.o. 18-24 y.o. 25-34 y.o. 35-44 y.o. 45-54 y.o. 54+y.o. Totals _______________________________________________________________________________________________________ White 14.4 16.1 10.8 8.6 6.7 23.6 80.1 Black 34.5 28.1 22.4 16.6 16.7 63.2 181.2 Asian 11.1 20.8 12.0 7.8 9.7 28.1 89.5 Hispanic 28.3 23.2 19.2 18.3 12.8 51.4 153.2 Totals 88.3 88.2 64.4 51.3 45.9 166.4 504.2 _______________________________________________________________________________________________________ Region Groups _______________________________________________________________________________________ Northeast Midwest South West Totatls __________________________________________________________________________________________________________________ White 9.2 9.0 11.4 12.0 41.6 Black 23.4 29.8 24.3 21.9 99.4 Asian 13.8 11.2 11.1 9.9 46.0 Hispanic 22.7 21.3 22.0 21.4 87.4 Totals 69.1 71.3 68.8 65.2 274.4 __________________________________________________________________________________________________________________ Source: U.S. Census Bureau, 2005-2006