Download
1 / 10
100 likes | 548 Vues
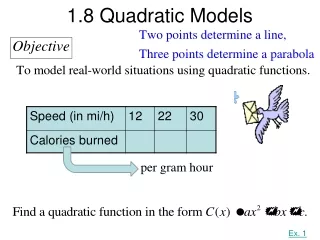
Section 7.7. Finding Quadratic Models. Example. The numbers of house calls paid by Medicare are shown in the table for various years.

E N D
Section 7.7 Finding Quadratic Models
Example The numbers of house calls paid by Medicare are shown in the table for various years. Let f (t) be the number of house calls (in millions) paid by Medicare in the year that is t years since 1995. Find an equation of a model to describe the situation. Section 7.7 Slide 2 Finding a Quadratic Model in Standard Form Finding an Equation of a Quadratic Model
Solution Process Continued 4. Create a scatter-gram and use the regression feature of the calculator to find the appropriate model that fits the data. Using the graphing calculator’s quadratic regression feature: Calculator Section 7.7 Slide 3 Finding a Quadratic Model in Standard Form Finding an Equation of a Quadratic Model
Example The number of federal documents that are classified has been increasing; so has the cost of keeping these documents secret (see the table). Let c be the federal cost of secrecy (in billions of dollars) in the year that is t years since 1990. Find the equation of a model to describe the situation Section 7.7 Slide 4 Determining Which Type of Model to Use Determining Which Model to Use
Example Section 7.7 Slide 5 Determining Which Type of Model to Use Determining Which Model to Use
Solution Use a graphing calculator to graph a scattergram Use a graphing calculator find an exponential regression model and a quadratic regression model Section 7.7 Slide 6 Determining Which Type of Model to Use Determining Which Model to Use
Solution Exponential Model Quadratic Model Section 7.7 Slide 7 Determining Which Type of Model to Use Determining Which Model to Use
Process When performing step 1 of the modeling process, we must decide whether a linear function, an exponential function, a quadratic function, or none of these is suitable for modeling the situation. Here are the criteria for selecting a model: • The graph of the model should fit the points well. • The model should make sense within the context of the authentic situation. Section 7.7 Slide 8 Determining Which Type of Model to Use Selecting a Model
Process To find a model and make estimates and predictions, 1. Create a scattergram of the data. Decide whether a line, an exponential curve, a parabola, or none of these comes close to the points. 2. Find an equation of your model. Section 7.7 Slide 9 Determining Which Type of Model to Use Four-Step Process
Process Continued Verify that your equation has a graph that comes close to the points in the scattergram. If it doesn’t, check for calculation errors or use different points to find the equation. An alternative is to reconsider your choice of model in step 1. Use your equation of the model to draw conclusions, make estimates, and/or make predictions. Section 7.7 Slide 10 Determining Which Type of Model to Use Four-Step Process