Download
1 / 12
1.38k likes | 6.73k Vues
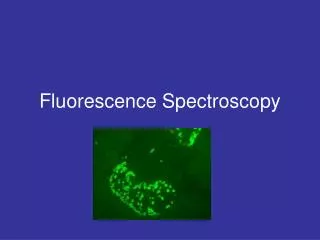
Fluorescence spectroscopy. Komal Choudhary Lecturer School of Biotechnology DAVV Indore. Fluorescence spectroscopy. Luminescence It is the emission of light from any substance, and occurs from energetically excited states. It is divided into two categories (1) Fluorescence

E N D
Fluorescence spectroscopy Komal Choudhary Lecturer School of Biotechnology DAVV Indore
Fluorescence spectroscopy • Luminescence It is the emission of light from any substance, and occurs from energetically excited states. It is divided into two categories (1) Fluorescence (2) phosphorescence
Non radioactive relaxation- excitation energy is dissipated as heat(vibration) to the solvent. • It includes internal conversion(IC) intersystem conversion(ISC). • Singlet state • Triplet state
Jablonski energy diagram tell us about the relaxation mechanism for exited state molecule. • Once a molecule has absorbed energy in the form of electromagnetic radiation there are numbers of routs by which it can return to ground state. • If the photon emission occurs between same spin state(i.e. S1-S0), this is called fluorescence emission. (release of energy is faster) • If the spin state of the initial and final energy level are different(i.e. T1-S0), this is called phosphorescence emission. (release of energy is slower)
Fluorescence spectroscopy or spectrofluorometry, is a type of electromagnetic spectroscopy which analyzes fluorescence from a sample. • Fluorescence is a phenomenon where by molecule after absorbing radiation emit the radiation of longer wavelength (compound absorb UV radiation, emit visible light). • stoke’s shift= λab-λemt • Best results are obtained from those compounds which showing large shifts.
Components of spectroflorimeter • Light source-xenon or mercury lamps • Slits • Two monochromator(prism or differaction grating) (1) excitation monochromator (2) emission monochromator • Sample holder(quartz cuvette) • Detector-photocell (red-sensitive PMT)
Fluorescence is the property of compounds having π-πtransition, π electron cloud. • Fluorescence is measured at right angle to sample holder to avoid the measurement of transmitted light. • Cuvettes are clear from all the sides unlike those used in spectrophotometer. • Fluorescence depends upon concentration of the sample.(particular range) • Quantum yield=no of photon emitted/ no. of photon absorbed (value lies always 0-1) • Quantity of any compounds in nanogram can be measured.(sensitivity)
Factors which affect fluorescence or quench the emission of fluorescence are • Solvent polarity • pH • Temperature • Viscosity • Presence of oxygen • Concentration of the sample molecule • Intensity of incident light
Fluorescent probes • Ethidium bromide • Flourescein • Densyl chloride • 1-Anilinonapthalene 8-sulphonate(ANS) • 4-methylumbelliferone • Acridine • GFP,RFP • Extrinsic fluorescence • Intrinsic fluorescence
Applications • Used in both qualitative and quantitative(major) estimation. • Assays of vitamin B in food stuff ,NADH, hormones, drugs, pesticides, Carcinogens, chlorophyll, cholesterol, metal ions etc. • enzyme assays and kinetic analysis. • Protein structure analysis. • Membrane structure analysis. • Microspectrofluorimetry (used to detect malignant cell in biopsy tissue) • FACS.