Download
1 / 49
810 likes | 1.73k Vues
Circular Dichroism. Part II. CD spectra of Nucleocide. Electron Molecular Energy. Chromophores of Nucleic Acid. p p * transitions begin about 300 nm n p * buried under p p * transitions

E N D
Circular Dichroism Part II. CD spectra of Nucleocide
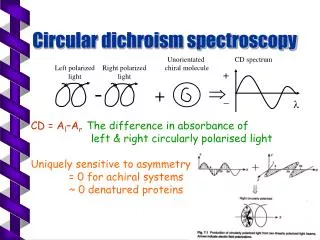
Chromophores of Nucleic Acid • p p*transitionsbegin about300nm • n p*buried under p p*transitions The intensity of the CD is low because it is a secondary effect of the asymmetric sugar inducing a CD in the chomophoric, but symmetric base.
Chromophores of Nucleic Acid Absorption Spectra CD Spectra
Base Stacking & CD spectra of Nucleic Acid • The benzene-like p-electron systems of the bases make them hydrophobic, so the bases tend to stack in hydrogen bonding solvents to minimize the p-electron surface area exposed to the solvent. • The NH, NH2 and CO groups are hydrophilic, so the edges of the bases will interact well with hydrogen bonding solvents • For nucleic acids the hydrophobic planes, the hydrophilic edges and charge-charge interactions cause the bases to stack and the polymers to assume a helical structure. • The electronic transitions of the chromophoric bases are in close proximity, and can interact to give CD spectra of high intensity.
Polymorphic properties of Nucleic Acid Polymorphism of nucleic acid in secondary structure • Number of base pairs per turn • Inclination of the base with respect to the helix axis • The distance of the bases from the helix axis • The rise per base-pair • Handedness of the helix CD can measure the change in secondary structure as a function of solvent conditions.
From monomer to polymer Polymer Formation of helical structure is a super asymmetry that gives rise to degenerate interactions between chromophoric bases and results in intense CD spectra dimer monomer CD of single stranded oilgo(rA) in aqueous solution at pH 7
Base-stacked helices in aqueous solution Spectra is Composition dependent CD of single stranded poly(rA) CD of single stranded poly(rC)
CD vs. Absorption Native DNA Denatured Native DNA • CD occurs only where normal absorption occurs • CD is more complicated revealing bands that not separated in the normal absorption spectrum Average spectrum for the four component deoxynucleotides
Structure of DNA A-DNA B-DNA Z-DNA
Discovery of Z-form DNA Pohl and Jovin (1972 JMB, 67,p375 ) were the first to observe the left-handed Z-form of poly(dGC)-poly(dGC), and they did this by using circular dichroism spectroscopy. • The Z-form DNA • negative band at 290 • positive band at 260 nm. • crossover about 185 nm • Z-form is not the mirror image of the B-form, the blue shift of the 200 nm of the B-form to 185 nm in the Z-form appears to be the trademark of the B to Z transition. A-DNA B-DNA Z-DNA
DNA Secondary Structure & CD Spectra A DNA 260 nm positive 210 nm intense negative 190 nm intense positive A-DNA B DNA 275 nm positive 240 nm negative 258 nm crossover B-DNA
The CD of E. coli DNA in various structure A-DNA 10.4 B-DNA 10.2 B-DNA Sprecher et.al. Biopolymer 17,1009
Solvent Effect on DNA Structure I Calf thymus DNA 0% methanol 25% methanol 10.4 base pair B-form 50% methanol 65% methanol 75% methanol 95% methanol 10.2 base pair B-form
Solvent Effect on DNA Structure II 90% methanol Titration with ethanol causes the same changes as with methanol in CD up to 65%. Adding more ethanol causes a change to A form 75% methanol 70% methanol 65% methanol
P Form DNA P-DNA (95% methanol/5% buffer) 330C P-DNA (47.5% methanol/5% buffer/4.5% ethanol) 80C B-DNA P-DNA 10.2 B-DNA (95% methanol/5% 80C)
Temperature Effect on DNA 58.30 C 48.20 C The CD of poly(dA) poly(dT) as a function of temperature 44.70 C 38.80 C CD is sensitive to the change in conformation when DNA melts with increasing temperature 10 C
Triplex Nucleic Acid 177 Triplex Poly(dA dT dT) 190 260 280 210 Duplex Poly(dA dT) 250
With Mg+2 Intra-molecular triplex Without Mg+2 With Mg+2 Intra-molecular triplex
Influence of the temperature on the parallel triplex 30C triplex 260nm 280nm 660C duplex 930C denature
Circular Dichroism Part III. CD spectra of Protein
Amide Chromphore • n p*centered around 220 nm • p p*centered around190nm n -> p* involves non-bonding electrons of O of the carbonyl; p -> p* involves the p-electrons of the carbonyl
Random coil positive at 212 nm (p->p*) negative at 195 nm (n->p*) b -Sheet negative at 218 nm (p->p*) positive at 196 nm (n->p*) a-helix positive (p->p*)perpendicular at 192 nm negative (p->p*)parallel at 209 nm negative at 222 nm is red shifted (n->p*)
Helix Content = 100×(〔θ〕222/max〔θ〕222) max〔θ〕222=-40,000[1-(2.5/n)], n=胺基酸之殘基數 Behrouz Forood et.al Proc.Natl.Acad.Sci.USA Vol.90,pp.838~842,February 1993
Applications of CD in Structural Biology • Determination of secondary structure of proteins that cannot be crystallised • Investigation of the effect of e.g. drug binding on protein secondary structure • Dynamic processes, e.g. protein folding • Studies of the effects of environment on protein structure • Secondary structure and super-secondary structure of membrane proteins • Study of ligand-induced conformational changes • Carbohydrate conformation • Investigations of protein-protein and protein-nucleic acid interactions
Software for the Analysis of Circular Dichroism Data Tools for analyzing circular dichroism data : • LINCOMB and MLR( The method of least squares) • CONTIN (The ridge regression procedure of Provencher and Glöckner) • VARSLC (The Variable Selection Method of Johnson and Coworkers ) • SELCON(The Self-Consistent Method of Sreerama and Woody ) • K2D.(A neural net analysis program of Andrade et al) • CCA(The convex constraint algorithm of Fasman and coworkers ) • SVD (Singular Value Decomposition ).