Download
1 / 37
370 likes | 621 Vues
Reliability and accident databases and their use in quantitative risk assessment. Vaidas Matuzas Lithuanian Energy Institute. Vilnius 28 March, 2012. Presentation outline. Quantitative Risk Analysis Process Hazard identification and Frequency Assessment Accident databases

E N D
Reliability and accident databases and their use in quantitative risk assessment Vaidas Matuzas Lithuanian Energy Institute Vilnius 28 March, 2012
Presentation outline • Quantitative Risk Analysis Process • Hazard identification and Frequency Assessment • Accident databases • Reliability databases • Reliability data adjustment • Summary
Risk (Safety) analysis is an important part of technological system design and safe operation process It has been about 40 years since Quantitative Risk Analysis (QRA) was applied to large technological system for the first time (WASH-1400, The reactor safety study, 1975) QRA and related techniques were soon deployed in the petrochemical, aerospace, electronics and other industries Nowadays QRA is applied to many hazardous facilities. It is used to demonstrate the risk caused by the establishment and helps competent authority on drawing decisions about the acceptability of risk related to developments on site of or around the establishment Introduction
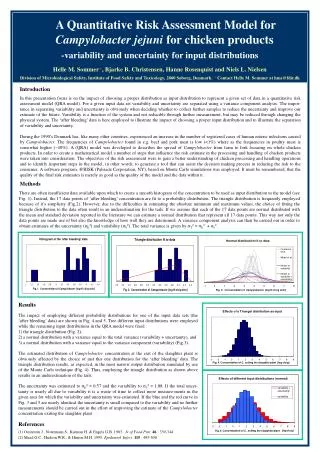
QRA produces quantitative results for the risk of an installation and enables comparison of different hazards. The QRA method allows aggregation of the risk of all installations to the total risk of a site. Moreover, this method also makes it possible to distinguish the risk contributions of various parts of an installation. In this method, scenarios and the corresponding failure frequencies play a significant role. As the methods and risk assessment procedures are well defined - the accuracy of the calculations is affected by the quality of the data used. Introduction
Risk Analysis & Management Process • QRA is part of the Risk Analysis and Risk Management process • Risk management is carried out to prevent, control or reduce the risk • Before this can be done, risk has to be measured using risk analysis Risk analysis Hazard identification Risk estimation Risk assessment Risk evaluation Risk tolerability Analysis of options Risk management Risk reduction Decision making Implementation/monitoring
What is Risk Risk = set of <scenario, frequency, consequence> What may be wrong? How dangerous is it? How frequent is it? • A risk analysis consists of an answer to the following three questions: • What can happen? (i.e., What can go wrong?) • How likely is it that that will happen? • If it does happen, what are the consequences? Risk = hazard / safeguards
How do we determine… • How do we determine the initiating events? • How do we determine the probability of the initiating events? • How do we determine the probability that each protection measure will function successfully?
Identification all of the hazards which pose the risk and the way in which they could be realized (i.e. initiating events and intermediate events) is performed initially Different techniques are employed to obtain comprehensive list of hazards, such as HAZOP, FMEA, check-lists, etc. The list is reduced by performing screening of negligible scenarios. Sometimes top-down approach is used. All potential leaks and major releases from fractures of all process pipes, equipment and vessels is considered. Resulting large number of scenarios is screened-out (generic failure data are used) and the selected scenarios are analyzed in detail. In both cases – selection of risk significant accidents for detailed analysis is a critical stage in risk analysis. Quality of this process can be increased by comparing the analysis with experience, including description of accidents which have occurred in similar systems and/or the system under considerations Hazard identification
Goals of an Accident Databases • To learn lessons from accidents to improve prevention, preparedness and response • Accident reporting, investigation and follow-up can help governments and industries: • Prevent similar accidents in the future • Set priorities for government and industry actions concerning chemical management • build public confidence that propersteps are being taken to prevent future accidents and manage chemicals responsibly
Databases for Accident Reporting • There are many accident databases operated by plant operators, governmental institutions, research organizations, etc. • Some databases are very generic and contains all types of accidents • Some databases cover only specific domain, like aviation, transport accidents, nuclear, chemical industry accidents, environmental accidents • eMARS, FACTS, ARIA, PSID, NEDIES, ECCAIRS, IRTAD (International Road Traffic and Accident Database, OECD), WOAD (World Offshore Accident Database, DNV), Ship/Platform Collision Incident Database (UK HSE report) , …
Databases for Accident ReportingARIA: Analysis, research and information on accidents (FR) • ARIA is operated by the French Ministry of Ecology, Energy, Sustainable Development • Lists the accidental events which have, or could have damaged health or public safety, nature or the environment mainly caused by industrial or agricultural facilities that have been or are likely to be classified as hazardous, but also by transportation of hazardous materials and other events with lessons that also apply in this context. • ~37000 accidents and incidents • ~30000 in France • Foreign accidents are listed mainly due to the seriousness of their consequences or their value in terms of experience feedback.
Databases for Accident ReportingMHIDAS: Major Hazard Incident Data Service (UK) • The major hazard incident data service (MHIDAS) is a database of incidents involving hazardous materials that had an off-site impact, or had the potential to have and off-site impact. Such impact includes human casualties or damage to a plant, private property or the natural environment. • MHIDAS was created for the purposes of Health and Safety Executive in the UK and includes more than 11,000 incidents, involving the transportation, storage and processing of hazardous materials. It covers incidents of all over the world with more emphasis on those that took place in the UK and the USA. Incident details comprise circumstances, consequences (fatalities, injuries and evacuations) and hazardous materials involved in the former
Databases for Accident ReportingFACTS: Failure and Accident Information System (NL) • FACTS is a database for accidents involving hazardous materials • Contains information about serious accidents that caused, or could have caused, severe damage and danger to the people and the environment. • The information stored in the database is obtained from professional sources, such as accident reports made by companies, governmental agencies or from publications in technical literature. • ~24300 accidents with hazardous materials
Databases for Accident ReportingCONCAWE: Accident Reports by Industry • CONCAWE - the Federation of the European Petrochemical Sector. Currently has 41 members, together representing practically 100% of the total crude oil refining capacity within the European Union • Accident data in the CONCAWE reports are coming from all sites that represent the petrochemical industry from receipt of crude oil to product sales, through refining, distribution and retail. • CONCAWE is considered as the best data source for oil pipeline leaks
Databases for Accident ReportingMARS/e-MARS: Major Accidents Reporting System • Articles 6 and 15 of the Directive 96/82/EC sets out the MS obligation regarding the exchange of information and notification of relevant accidents The register and information system MARS/e-MARS has two objectives: - to collect data on ‘major accidents’ supplied by MS to the European Commission in compliance with Art. 15; - to build an informative/formative system as to the different aspect relevant to the historical experience acquired by MS on major accidents.
Databases for Accident ReportingUS Chemical Safety Board - Accident Reports
The likelihood of each undesired event identified at the hazard identification stage is estimated using Frequency analysis. The most widespread QRA techniques are event tree and fault tree analysis. FT/ET combination is schematically presented in the so-called bow tie. Use of expert judgment Use of relevant historical data (plant specific or retrieved from reliability databases) Frequency Analysis
Frequency Analysis • Scenario starts with a basic failure event and leads to the central event (the accident, e.g. the release of a chemical substance). • From this central event several and different consequences can be developed with their specific outcomes.
There are several levels of detail in which a quantitative risk assessment can be carried out. - The possibility of having an accidental failure is developed from the failure frequencies of the basic system components like pumps, pressure sensors, level gauges, etc. - This approach gives much insight in the different contributions of all the components in an installation to the resulting risk. However, the method is very elaborate and requires much credible data for reliability and failure of these components. In the chemical industry a QRA, in general, is less detailed. - Failure frequencies are only used for the main components or even only for the accidental event. - The frequencies used are based on historical data of incidents. Frequency Analysis
Data Sources for Frequency Analysis • It is preferred to use data collected from the same equipment (equipment specific failure data). On-site reliability data collection in relation to all types of components from the field records of installations and operations is used. • Complete and exact data are needed concerning equipment functioning, failures and failure modes, maintenance operations and their costs • Plant specific data- plant event records- test records- maintenance records- defect records- component reliability data collection
Alternatively data from analogous equipment operating in similar conditions are used (generic data) Any quantitative risk estimate resulting from QRA only makes sense when the employed data originate from events whose “technical background” is comparable Use of generic data means loss of specificity relative to single plant data. However, they provide a greater pool of records and larger population of equipment experience By using generic data it is important to ensure: - Completeness: there’s no under-reporting- Relevance: population is appropriate- Significance: population is sufficiently large (statistically significant)- Inclusiveness: all the important failure causes are reported Data Sources for Frequency Analysis
Estimation of failure frequencies for quantitative risk assessment can usually not be accomplished by industrial accidents databases due to missing information on the underlying equipment populations, but is the objective of reliability databases Reliability databases are used by designers, risk assessment teams, operation and maintenance personnel (optimization of maintenance and operation) Sometimes generic data are used for initial risk assessment as it is more easy to obtain them. Plant specific data are used at a later stage when higher accuracy is needed. Reliability data
Automobile and aircraft industry initiated shared use of reliability and risk databases for prediction of future events probabilities Aviation transport must be reliable and safe, and this fact became a basis for gathering of maintenance statistics and attempts at redesigning or replacing of frequently failing items First broadly published source of reliability data – “Martin Titan Handbook”, 1959: failure rates of electrical, electronic, electromechanical and mechanical parts and assemblies MIL-HDBK-217 – Reliability prediction of electronic equipment T-book – reliability data collection for equipment from Nordic nuclear power plants Reliability databases
New generation of reliability databases appeared following introduction of computer-aided systems. Special databases being managed by software tools were adopted for reliability data collection Computerized databases allowed the user to retrieve data more rapidly and to analyze them statistically GIDEP - Government Industry Data Exchange Program was the first computerized reliability database (also known as FARADA – Failure Rate Data Bank) OREDA – Reliability Data for equipment in offshore installations PERD – Process equipment reliability database, run by The American Institute of Chemical Engineers … Reliability databases
Reliability databases cover different kind of components. Some of them are very generic, some specializes in specific industry- Electronic components- Mechanical and electromechanical components- Nuclear, Chemical, etc. installations- Safety equipment- Process equipment Based on the database type – different reliability data are defined and collected Reliability databases
OREDA Database Established as the forum for collection and exchange of reliability data, and utilization of reliability methods within the oil & gas industry A comprehensive databank with Exploration & Production reliability data collected worldwide on: • Offshore topside and subsea equipment • Onshore equipment
The T-book presents reliability data for components, mainly focused on the components in safety-related systems from twelve Swedish and two Finnish NPPs. The T-Book only contains data based on critical failures, failures that stops the function of the components or leads to repair. The following types of data are presented in the T-book:- The time independent probability of failure on demand (i.e. probability that a pump will not start)- The time dependent failure characteristic represented by a failure rate in standby- The failure rate during operation- The mean active repair time: The time during which a component is actively repaired. The 5th, 50th, 95th percentiles and the mean values are presented for q and λ. Only a point estimate is given for the repair time. The T-book is considered to contain top quality reliability data The T-book
PERD – Process equipment reliability data. Covers Instrument Loops, Piping circuits, spring operated relief valves, in-line centrifugal compressors, remote actuated valves IEEE Std. 500-1984: IEEE Guide to the Collection and Presentation of Electrical, Electronic, Sensing Component, and Mechanical Equipment Reliability Data for Nuclear Power Generating Stations Eireda – contains critical failures of components important for the safety of nuclear power plants in France. Contains data on electrical, mechanical and electromechanical equipment ZEDB – gathers and analyses operating experience gained at nuclear power plants in Germany, Netherlands and Switzerland. Collects operating experience and reliability data for safety-related nuclear power plant components. Similar data sources
Due to the wide dispersion of failure rates, which occur for apparently similar components, mechanical reliability predictions do not rely on failure rate data alone Material properties, operating environment and critical failure mode at the component level are considered as well. Failure modes such as corrosion, erosion, creep and fatigue can simultaneously impact a mechanical component, causing an adverse effect on the reliability. Individual mechanical devices often perform more than one function, and failure data for a specific application may not be available. Valves for example, may contain a manual shut-off function, as well as an automated control ability. Failure rates of mechanical devices do not normally follow a constant failure rate distribution, due to wear, fatigue, and other stresses which degrade the equipment. Failure date reliability is complicated when a constant failure rate distribution cannot be assumed. Individual failure times must be recorded in addition to total operating hours and failures. Failure rate adjustment
Mechanical equipment reliability is more sensitive to loading, operating mode, and utilization rates than electronic equipment reliability. Failure data based upon operating time alone is usually inadequate. The definition of a failure of mechanical equipment will depend upon its application. Failure due to excessive leakage cannot be modeled generically. Lack of a clear definition limits the usefulness of the data. Reliability prediction of mechanical equipment should consider the intended operating environment. Combining these factors permits the use of design parameters to determine the design life of the equipment in the operating environment and the rate and pattern of failures. Failure rate adjustment
Failure rate adjustment For example, a Base failure rate as determined by the handbookfor Valve assembly can be adjusted based on: • Fluid pressure factor • Allowable leakage factor • Fluid viscosity factor • Contaminants factor • Fluid flow rate factor
Mixing generic and plantspecific data • A common problem in reliability and risk assessment is the estimation of failure rate, other reliability data estimates, and the updating of these uncertain estimates as more information becomes available. • If the initial estimate is obtained from the uncertain (generic) data it has to be revised in the light of new data. • The basic procedure is to establish a prior probability distribution, for each failure rate, using generic or industry wide information and to specialise this distribution to the specific plant using the specific operating experience of that plant. • Bayes’ theorem is frequently used to estimate event frequencies, reliability data, and rare event probabilities based on observed experience.
Mixing generic and plantspecific data When large amount of data has to be updated – specialized software tools has to be used to facilitate updating process
QRA can quantify probability of known threats, but it cannot reveal unknown vulnerable sequences. QRA event trees and “master level” fault trees are based on those threats, which are identified or defined by expert judgment and analyzed in detail. If the accident scenario simulations are not covering vulnerable sequences, the threats remain unknown In Summary…
Unavailability of required data could lead to:- Possibility of systematic bias- Uncertainty in frequencies or risk estimates- Incorrect prioritization of major risk contributors No matter how excellent the mathematical modeling, how precise the analysis, and how detailed the resulting formulae, ultimately the prediction can be no more accurate than the numerical data which are substituted into them (Blanks, 1977) In Summary…
Analysis completeness can never be assured Uncertainty on the estimated risk due to the use of generic data cannot be avoided, however sensitivity studies can help filling the gap In Summary…