Download
1 / 37
390 likes | 603 Vues
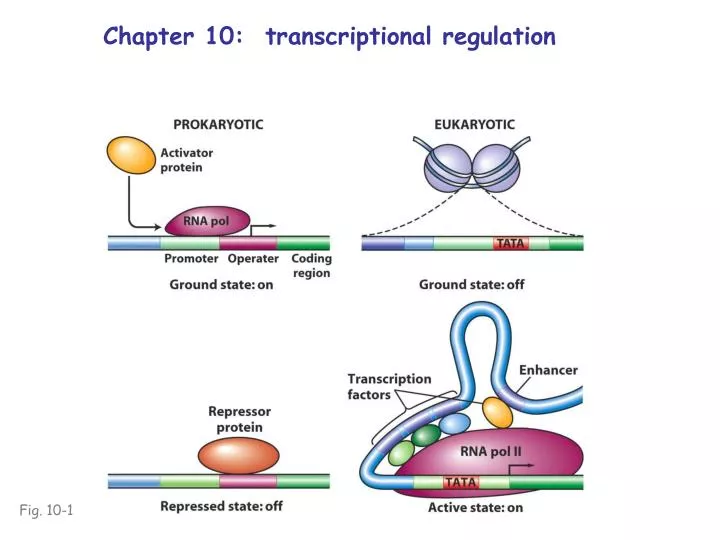
Chapter 10: transcriptional regulation. Fig. 10-1. Regulation of Gene Transcription DNA-binding proteins RNA polymerase binding to the transcription initiation site ( e.g., promoter ) Regulatory protein(s) binding to other sites ( e.g., operator )

E N D
Chapter 10: transcriptional regulation Fig. 10-1
Regulation of Gene Transcription • DNA-binding proteins • RNA polymerase binding to the transcription • initiation site (e.g.,promoter) • Regulatory protein(s) binding to other sites • (e.g.,operator) • Regulatory protein binding can positively or • negatively regulate transcription
Positive/negative regulation: binding of activator or repressor proteins Fig. 10-2
Regulation of Gene Transcription • DNA-binding proteins • RNA polymerase binding to the transcription • initiation site (e.g.,promoter) • Regulatory protein(s) binding to other sites • (e.g.,operator) • Regulatory protein binding can positively or • negatively regulate transcription • Protein affinity for DNA or for other proteins can • be influenced by allosteric conformation
Effector binding mediates allosteric change Effector promotes activator binding Effector prevents repressor binding Fig. 10-3
Fig. 10-5 In mammalian newborns, lactose is the principal sugar source for intestinal flora
Lactose utilization by E. coli • -linkeddisaccharide peculiar to milk • lac genes encode a glycosidase and proteins • that promote cellular import of lactose • Genes are transcribed only in the presence of • lactose (inducible) and the absence of glucose • (catabolite repression) • Genes are organized into a co-transcribed cluster • (operon; encodes a polycistronic mRNA)
lac operon in E. coli (simplified schematic) Fig. 10-4
lac operon in E. coli (dynamic schematic) Fig. 10-6
Effects of mutations within consensussequences of E. coli promoters Fig. 10-11
Effects of lac operator mutations Fig. 10-12
E. coli lac is also regulated by catabolite repression • Regulates preferential utilization of glucose • Mediated by cAMP (glucose-responsive) • cAMP is effector of catabolite activator protein (CAP) • cAMP-CAP binds to lac promoter, enhancing • binding of RNA polymerase
Activated CAP binding induces a distortion of its DNA binding site “presents” P region to RNA polymerase Fig. 10-15
Molecular organization of the lac promoter region Fig. 10-16
Cumulative regulatory control of lac transcription Fig. 10-17
Cumulative regulatory control of lac transcription Fig. 10-17
“Negative control” (repression) “Positive control” (activation) Fig. 10-18
Typical 5’ end sequences found in eukaryote genes (promoter and nearby elements) RNA polymerase binding site Fig. 10-22
β-globin promoter region and effects of mutation Consensus sequences predict important regions which experiments can often confirm Fig. 10-23
Eukaryote polymerase binding and transcription initiation are determined by cooperative interactions of diverse proteins with diverse DNA sequences Enhancer-binding factors can be tissue-specific Near DNA sequences: promoter-proximal elements Distance-independent DNA sequences: enhancers/silencers Fig. 10-24
Drosophila dpp gene region contains many tissue-specific enhancers Visceral mesoderm enhancer (VM) Lateral mesoderm enhancer (LE) Imaginal disk enhancer (ID) Most tissue/cell-specific gene expression in eukaryotes is controlled by enhancers Fig. 10-27
Chromosome rearrangements that • create new physical relationships • among genes can result in • gain-of-function mutation • The In(3R)Tab mutation • brings into close proximity: • sr enhancer sequences • (drive thorax expression) • Abd-B gene • (product drives expression • of abdominal pigmentation) +/+ Tab/+ Fig. 10-28
Chromatin structure influences gene expression • Euchromatin: rich in active genes • Heterochromatin: • Constitutive heterochromatin (e.g., centromere regions) • few active genes • Facultative heterochromatin: euchromatin in some cells, • heterochromatic in others • rich in genes; genes are transcriptionally silent • Epigenetic inheritance: inheritance of genes with same DNA • sequence, but different levels of expression
Mammalian X-chromosome heterochromatization • dosage compensation • inactivation of one X in female cells • (heterochromatic X is “Barr body”) • selection of X occurs in early embryo • (then is fixed for clonal populations) • mammalian females mosaically express • their X-linked genes Fig. 10-30
Imprinting: recently discovered in mammals DNA methylation usually results in reduced levels of gene expression Differential methylation of genes and transmission of that methylation can result in imprinting phenomena Fig. 10-32
Prader-Willi syndrome can arise “de novo” through a combination of mutation and imprinting Fig. 10-31
Position-effect variegation (PEV): relocation of euchromatic genes to the vicinity of heterochromatin can result in mosaic inactivation Clonal-determined heterochromatin spreading Fig. 10-34