Download
1 / 90
900 likes | 1.18k Vues
Peak Oil - the emerging reality Who am I? Chris Skrebowski has spent half his working life in the oil industry and the rest as an oil journalist Free of corporate or political pressure he brings a healthy scepticism to the problem Not pessimistic by nature, not anti-Oil

E N D
Who am I? Chris Skrebowski has spent half his working life in the oil industry and the rest as an oil journalist Free of corporate or political pressure he brings a healthy scepticism to the problem Not pessimistic by nature, not anti-Oil Basic approach to Peak Oil analysis Don’t guess, assume or hope - let the numbers talk Observe what companies do, not what they say
An important disclaimer In this presentation the opinions expressed are entirely those of Chris Skrebowski in his capacity as an ODAC Trustee and as such do not necessarily reflect the view of the Energy Institute for whom he edits Petroleum Review
The challenge of Peak Oil • To meet a challenge • You first have to recognise you face a challenge • I aim to show you that: • ‘Peak Oil’ is real and imminent • That time is short • That adaptation will not be easy
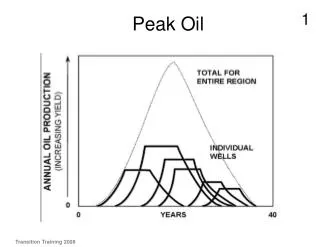
So what is ‘Peak Oil’? • It is the point when further expansion of oil production becomes impossible because: • New production flows are fully offset by production declines (depletion) • You never run out of oil • You do run out of incremental flows • The world needs oil products to support growth
The practical realities • The world needs oil production flows • Consumers need delivery flows • Reserves are only useful as flows • Peak oil is when flowscan’t meet the required demand • This will cause an ‘Economic Tsunami’ • Worry aboutflows not reserves
Alaskan North Slope ProductionReserves grow -- Production falls
Peak Oil matters because oil dominates its markets • 80-95% of all transport is fuelled by oil products • 50-75% of all oil is used for transportation • All petrochemicals are produced from oil • 99% of all lubrication is done with oil products • 95% of all goods in the shops get there using oil • 99% of our food involves oil or gas for fertilisers, agrochemicals, tilling, cultivation and transport • Oil is the most important source of primary energy on the planet accounting for 36.4% of all energy
A simple observation -- or why peak will be earlier than most people expect ‘Global production falls when loss of output from countries in decline exceeds gains in output from those that are expanding.’
What economics really says • Economics requires that supply and demand always balance • Economists have assumed that supply will expand to meet demand via a high price signal • If supply can’t expand we need the high prices to ‘destroy demand’ • How high do prices need to go?
The CIBC answer • Assessed the likely supply shortfall and the oil price needed to reduce demand • 2006 1mn b/d and $61/barrel • 2007 2.8mn b/d and $70/barrel • 2008 4.8mn b/d and $80/barrel • 2009 6.7mn b/d and $90/barrel • 2010 8.9mn b/d and $101/barrel
Why are oil supplies peaking? • We are not finding oil fast enough • We are not developing fields fast enough • Too many fields are old and declining • We are short of people and equipment • Oilfield inflation is soaring • Our societies are totally oil dependent • Oil supply will peak soon. How soon?
The real discovery trend Past discovery according to ExxonMobil
Oil production flows -- all new flows take two to twenty-five years Global new field discovery (7-10bn b/y) Tar sands and Heavy oil Biofuels + others Known oil reserves in production (90%) NIP 10% EOR Yet-to-find probable Yet-to-find possible Current supply 84mn b/d or 30bn b/y 2 to 25 years
How old are the fields? • Of the 18 largest fields, 12 are in decline, 5 have some potential and 1 is undeveloped • The 120 largest fields give 50% of total • 70% of production from fields 30+ years old • Few large recent discoveries • We’re dependent on the oil equivalent of ‘Old men and young boys’
What are the BP statistics saying? • OECD production peaked in 1997 and has now declined by just under 2 million b/d (8.8%) • Non-Opec, non-FSU production peaked 2002 • North America/Mexico peaked in 1997 • North Sea - UK/Norway/Denmark peaked in 2000 now declined by 1.2 million b/d (19.2%) • Around 25 significant producers in decline • About 28% of global production from decliners
The UKCS depletion reality -- production down to 1mn b/d by 2010
North Sea production by field Forties monthly production to date
North Sea production by field Brent monthly production to date
The oil companies are already struggling to hold production(21 quoted co.’s account for 25% of global production) • In 2004 and 2005 oil production growth was: • 3.8% (04) but 0.4% (05) for the top 5 (13.5% of global) • 2.5% (04) but 1.3% (05) for the top 10 (21% of global) • 3.2% (04) but 0.5% (05) for the top 21 (26% of global) • In 2004 and 2005 gas production growth was: • -1.7% (04) but -3.0% (05) top 5 (13.5% of global) • 2.5% (04) but 1.3% (05) for the top 10 (20% of global) • 3.2% (04) but 0.5% (05) for the top 21 (28% of global • Annual decline rates up to 5%, quarterly 8%
About to go into decline(More Type 3 losses) • Denmark producing 0.4mn b/d went in 2005 • Malaysia producing 0.9mn b/d went in 2005 • Mexico producing 3.8mn b/d went in 2005 • Vietnam producing 0.4mn b/d went in 2005 • India producing 0.8mn b/d goes in 2006/07 • China producing 3.6mn b/d goes in 2007/08 • Collectively 9.9mn b/d or 12.3% of production • Iran is struggling -- next to go?
So what happened in 2005? • The world added 2.581mn b/d of capacity • 1.175mn b/d Opec, 1.406mn b/d non-Opec • Depletion was 1.261mn b/d mostly non-Opec • Then the Hurricanes cost 0.280mn b/d • So that left just 1.04mn b/d to meet new demand, only 40.3% of gross new capacity • No wonder prices remained high
The oil depletion balance sheet at end 2005 and by 2008/9 • In decline 28% but rising to 40% by 2008/9 • In danger 12% but declining to 10% by 2008/9 • Growing 48% but declining to 38% by 2008/9 • Russia 12% and steady at 12% by 2008/9 • The scales appear ‘balanced’ by 2008/9 • So does President Putin decide when decline starts? Or does Saudi geology? Or can we drive it out to 2010 to 2011?
How the Megaprojects database is created and used • All publicly available data • 2006-2012 148 Opec and 70 non-Opec projects • Unallocated by date Opec 12, non-Opec 36 • Opec data (from their website) • Incremental production allocated by start up date • Production increments summed by year • Graphed to show volumes available to meet demand
Then we add the depletion reality(and other negative factors) • Projects slip (typically around 20% each year) • Companies are always optimistic (take 10% off peak) • Depletion is already 1.2mn b/d and rising • Enhanced recovery is slow and limited (0.5%/ yr) • Depletion rates are rising (6%? 8%?) • The number of countries in decline is rising • 90% of known reserves are in production (oil higher)
This is the real new capacity to 2012 (Peak in first quarter of 2011)
If we reduce the depletion rate by a third(Peak moves forward by three months)
Massive extra production 2011-2012(Peak moves forward 12 months)
If depletion accelerates by a third (Peak moves backwards by 4 months)
The wild card -- Oil producers own consumption -- subsidised & +4%/yr (Opec plus Russia plus Mexico)
Wild cards on the Supply side • If Iraqis learn to love each other possible supply growth of 1-1.5mn b/d by 2012? • Iran is struggling to hold production will their production grow or decline by 2012? • Saudi is drilling like crazy and spending freely to boost production. Will the redevelopment of all those old fields really boost production and for how long?
Six key mitigations -- but hurry • Efficiency in use • Biofuels • Heavy oils and tarsands • Clean coal to create syngas • Gas to liquids • Renewables and nuclear for power generation
2006 Study 16 14 12 EOR Millions of Barrels Per Day 10 8 Oil Shale 6 4 Coal Liquefaction 2 Vehicle Fuel Efficiency 0 0 2 4 6 8 10 12 14 16 18 20 Years after Crash Program Initiation U.S. Crash Program to Cut Imports
2005 Study 35 EOR Coal Liquids 25 Impact (MM bpd) Heavy Oil 15 GTL 5 Efficient Vehicles 0 0 5 10 15 20 Years After Crash Program Initiation Worldwide Crash Program Mitigation of Conventional Oil Production Peaking A Study for DOE NETL Delay / Rapid growth. Roughly 35 MM bpd at year 20.
My conclusions • Supply will remain tight and prices high barring a major economic setback • Oil supply will peak in 2010/2011 at around 92-94 million barrels/day • Oil supply in international trade may peak earlier than the oil production peak • Collectively we are still in denial • WE HAVE JUST 1,500 DAYS TO PEAK
By 2012 Will this be the only practical use for SUVs or 4X4s?
Chris Skrebowski Editor, Petroleum Review cs@energyinst.org.uk + 44 (0)20 7467 7117 Contact:
Association for the Study of Peak Oil & Gas ASPO-International Ireland and Sweden www.ASPO-Australia.org.au A network of professionals working to reduce oil vulnerability ODAC The Oil Depletion Analysis Centre www.ODAC-Info.org Aberdeen
Collectively Humanity is: • Very clever, very ingenious, very adaptable • So it is reasonable to be optimistic • It is reasonable to anticipate fuels and solutions we cannot currently envisage • But humanity is also greedy, competitive, short-sighted and tribal • Concern & apprehension are appropriate
Current status of UKCS and onshore(as at May 2006) • DTI itemises production from 329 fields • 6 growing - Franklin, Rhum, Clair, Maclure, Broom and Farragon • 6 flatlining - Captain, Goldeneye, Hannay, Howe, Judy? and Scoter • All others (317) in decline but, about 100 stabilising at low levels