Download
1 / 27
270 likes | 427 Vues
Analysis of the Rijkoort-Weibull model: Accept or reject?. Ilja Smits Royal Netherlands Meteorological Institute. Overview: Description of the RW-model Quality of the RW-model Adjustments to the RW-model. Goal of the RW-model:

E N D
Analysis ofthe Rijkoort-Weibull model:Accept or reject? Ilja Smits Royal Netherlands Meteorological Institute
Overview: • Description of the RW-model • Quality of the RW-model • Adjustments to the RW-model
Goal of the RW-model: Calculating frequency distributions of wind speed for arbitrary locations in the Netherlands. In particular, the model is capable to estimate extreme values of hourly mean wind speed values for long return periods. Our goal: Estimating extreme values of hourly mean wind speed values for return periods up to 10,000 year.
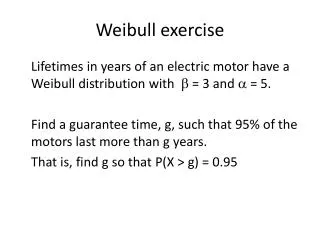
Basis of the RW-model: Weibull distribution
Data division into: • Season • Wind direction • Day/Night Reduction of the number of parameters by harmonic analysis of wind direction and further smoothing
Wind direction: Season: Any arbitrary moment:
Determination of persistence correction factors: 1) 2) 3) Averaging of Aij and Bij over stations
C1 = 0.83 C2 = 0.50 C3 = 0.50
q=0.36 q=0.0027 31.2
Alternative models: • GEV distribution • Simulation with Markov-chain • Analysis of storms