Download
1 / 26
260 likes | 396 Vues
Sampling for Estimation. Instructor: Ron S. Kenett Email: ron@kpa.co.il Course Website: www.kpa.co.il/biostat Course textbook: MODERN INDUSTRIAL STATISTICS, Kenett and Zacks, Duxbury Press, 1998. Course Syllabus. Understanding Variability Variability in Several Dimensions

E N D
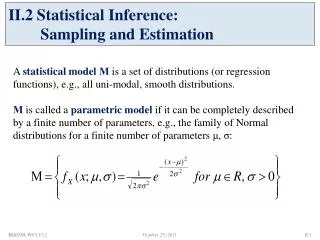
Sampling for Estimation Instructor: Ron S. Kenett Email: ron@kpa.co.il Course Website: www.kpa.co.il/biostat Course textbook: MODERN INDUSTRIAL STATISTICS, Kenett and Zacks, Duxbury Press, 1998 (c) 2001, Ron S. Kenett, Ph.D.
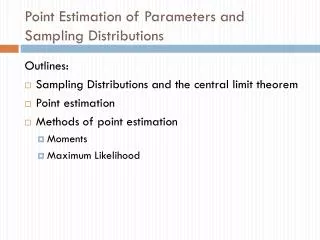
Course Syllabus • Understanding Variability • Variability in Several Dimensions • Basic Models of Probability • Sampling for Estimation of Population Quantities • Parametric Statistical Inference • Computer Intensive Techniques • Multiple Linear Regression • Statistical Process Control • Design of Experiments (c) 2001, Ron S. Kenett, Ph.D.
Key Terms • Error • Sampling • Nonsampling • Standard error • of the mean • of the proportion • Standardized • individual value • sample mean • Finite Population Correction (FPC) • Probability sample • Simple random sample • Systematic sample • Stratified sample • Cluster sample • Nonprobability sample • Convenience sample • Quota sample • Purposive sample • Judgment sample (c) 2001, Ron S. Kenett, Ph.D.
Key Terms • Unbiased estimator • Point estimates • Interval estimates • Interval limits • Confidence coefficient • Confidence level • Accuracy • Degrees of freedom (df) • Maximum likely sampling error (c) 2001, Ron S. Kenett, Ph.D.
Types of Samples Probability, or Scientific, Samples: Each element to be sampled has a known (or calculable) chance of being selected. • Simple random • Systematic • Every person has an equal chance of being selected. Best when roster of the population exists. • Randomly enter a stream of elements and sample every kth element. Best when elements are randomly ordered, no cyclic variation. (c) 2001, Ron S. Kenett, Ph.D.
Types of Samples Probability, or Scientific, Samples: Each element to be sampled has a known (or calculable) chance of being selected. • Stratified • Cluster • Randomly sample elements from every layer, or stratum, of the population. Best when elements within strata are homogeneous. • Randomly sample elements within some of the strata. Best when elements within strata are heterogeneous. (c) 2001, Ron S. Kenett, Ph.D.
Types of Samples Nonprobability Samples: Not every element has a chance to be sampled. Selection process usually involves subjectivity. • Convenience • Quota • Elements are sampled because of ease and availability. • Elements are sampled, but not randomly, from every layer, or stratum, of the population. (c) 2001, Ron S. Kenett, Ph.D.
Types of Samples Nonprobability Samples: Not every element has a chance to be sampled. Selection process usually involves subjectivity. • Purposive • Judgment • Elements are sampled because they are atypical, not representative of the population. • Elements are sampled because the researcher believes the members are representative of the population. (c) 2001, Ron S. Kenett, Ph.D.
s s = . x n Distribution of the Mean • When the population is normally distributed • Shape: Regardless of sample size, the distribution of sample means will be normally distributed. • Center: The mean of the distribution of sample means is the mean of the population. Sample size does not affect the center of the distribution. • Spread: The standard deviation of the distribution of sample means, or the standard error, is (c) 2001, Ron S. Kenett, Ph.D.
s n - m m sample mean x – = = z s standard error n The Standardized Mean • The standardized z-scoreis how far above or below the sample mean is compared to the population mean in units of standard error. • “How far above or below” sample mean minus µ • “In units of standard error” divide by Standardized sample mean (c) 2001, Ron S. Kenett, Ph.D.
Distribution of the Mean • When the population is not normally distributed • Shape: When the sample size taken from such a population is sufficiently large, the distribution of its sample means will be approximately normally distributed regardless of the shape of the underlying population those samples are taken from. According to the Central Limit Theorem, the larger the sample size, the more normal the distribution of sample means becomes. (c) 2001, Ron S. Kenett, Ph.D.
s s = . x n Distribution of the Mean • When the population is not normally distributed • Center: The mean of the distribution of sample means is the mean of the population, µ. Sample size does not affect the center of the distribution. • Spread: The standard deviation of the distribution of sample means, or the standard error, is (c) 2001, Ron S. Kenett, Ph.D.
Distribution of the Proportion • When the sample statistic is generated by a count not a measurement, the proportion of successes in a sample of n trials is p, where • Shape: Whenever both n pand n(1 –p) are greater than or equal to 5, the distribution of sample proportions will be approximately normally distributed. (c) 2001, Ron S. Kenett, Ph.D.
p ׳ p ( 1 – ) s = . p n Distribution of the Proportion • When the sample proportion of successes in a sample of n trials is p, • Center: The center of the distribution of sample proportions is the center of the population, p. • Spread: The standard deviation of the distribution of sample proportions, or the standard error, is (c) 2001, Ron S. Kenett, Ph.D.
p ׳ p ( 1 – ) s = p n - p sample proportion p p – = = z p ׳ p ( 1 – ) standard error n Distribution of the Proportion • The standardized z-scoreis how far above or below the sample proportion is compared to the population proportion in units of standard error. • “How far above or below” sample p–p • “In units of standard error” divide by Standardized sample proportion (c) 2001, Ron S. Kenett, Ph.D.
Finite Population Correction • Finite Population Correction (FPC) Factor: • Rule of Thumb: Use FPC when n > 5%•N. • Apply to: Standard errors of mean and proportion. (c) 2001, Ron S. Kenett, Ph.D.
x i x x = n 2 ( x – x ) 2 2 i = s s n – 1 x successes p p = n trials Unbiased Point Estimates Population Sample Parameter Statistic Formula • Mean, µ • Variance, s2 • Proportion, p (c) 2001, Ron S. Kenett, Ph.D.
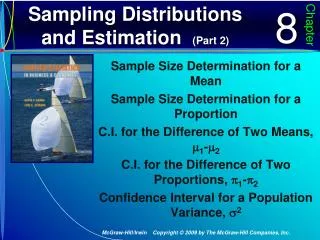
+ z : – z 0 z s s ׳ + ׳ x : x – z x x z n n Confidence Intervals: µ, s Known where = sample mean ASSUMPTION: s = population standard infinite population deviation n = sample size z = standard normal score for area in tail = a/2 (c) 2001, Ron S. Kenett, Ph.D.
+ t : – t 0 t s s ׳ + ׳ x : x – t x x t n n Confidence Intervals: µ, s Unknown where = sample mean ASSUMPTION: s = sample standard Population deviation approximately n = sample size normal and t = t-score for area infinite in tail = a/2 df = n– 1 (c) 2001, Ron S. Kenett, Ph.D.
p ( 1 – p ) p ( 1 – p ) ׳ + ׳ p : p – z p p z Confidence Intervals on p where p = sample proportion ASSUMPTION: n = sample size n•p > 5, z = standard normal score n•(1–p) >5, for area in tail = a/2 and population infinite (c) 2001, Ron S. Kenett, Ph.D. n n
Confidence Intervals for Finite Populations • Mean: or • Proportion: (c) 2001, Ron S. Kenett, Ph.D.
Interpretation of Confidence Intervals • Repeated samples of size n taken from the same population will generate (1–a)% of the time a sample statistic that falls within the stated confidence interval. OR • We can be (1–a)% confident that the population parameter falls within the stated confidence interval. (c) 2001, Ron S. Kenett, Ph.D.
s = ׳ e z n 2 2 ׳ s z = n 2 e Sample Size Determination for Infinite Populations • Mean: Note s is known and e, the bound within which you want to estimate µ, is given. • The interval half-width is e, also called the maximum likely error: • Solving for n, we find: (c) 2001, Ron S. Kenett, Ph.D.
Sample Size Determination for Finite Populations • Mean: Note s is known and e, the bound within which you want to estimate µ, is given. where n = required sample size N = population size z = z-score for (1–a)% confidence (c) 2001, Ron S. Kenett, Ph.D.
p ( 1 – p ) = ׳ e z n 2 z p ( 1 – p ) = n 2 e Sample Size Determination of p for Infinite Populations • Proportion: Note e, the bound within which you want to estimatep, is given. • The interval half-width is e, also called the maximum likely error: • Solving for n, we find: (c) 2001, Ron S. Kenett, Ph.D.
p ( 1 – p ) n = 2 p ( 1 – p ) e + N 2 z Sample Size Determination of p for Finite Populations • Mean: Note e, the bound within which you want to estimate p, is given. where n = required sample size N = population size z = z-score for (1–a)% confidence p = sample estimator of p (c) 2001, Ron S. Kenett, Ph.D.