Download
1 / 5
50 likes | 215 Vues
Infant Feeding and Climate Change. Patricia Ip Hong Kong Special Administrative Region. Status of Formula Feeding practice. Infant feeding % Exclusive BF Mixed Formula Birth 19.7 48.5 31.7 6 m 9.0 9.5 81.4

E N D
Infant Feeding and Climate Change Patricia Ip Hong Kong Special Administrative Region
Status of Formula Feeding practice Infant feeding % Exclusive BF Mixed Formula • Birth 19.7 48.5 31.7 • 6 m 9.0 9.5 81.4 • 12 m 1.7 6.9 91.4 with comp food (Tarrant M 2010)
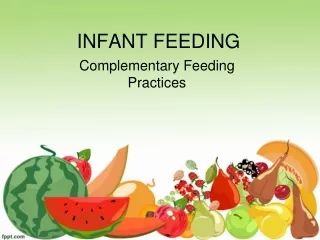
Status of Commercial Complementary feeding practice • Market for baby food increased at a compound annual rate of 5% between 2004-2009 • Bottled baby food ~60.7% • Leading players: Nestle SA and HJ Heinz Company www.datamonitor.com
Trends in (exclusive) formula feeding and (commercial complementary feeding)
Possible Green House Gas (GHG) Emissions • 62,706 • 1,790,047 kg formula milk in one year • GHG emission (66.7 tons / 4,356 kg) 27,409 tons carbon dioxide equivalent in one year (Information on monthly exclusive breastfeeding and mixed feeding to 12 months from Tarrant M 2010)