Download
1 / 27
270 likes | 281 Vues
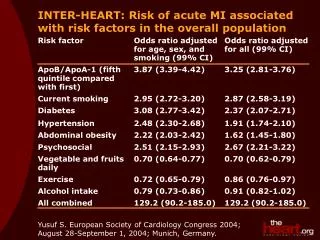
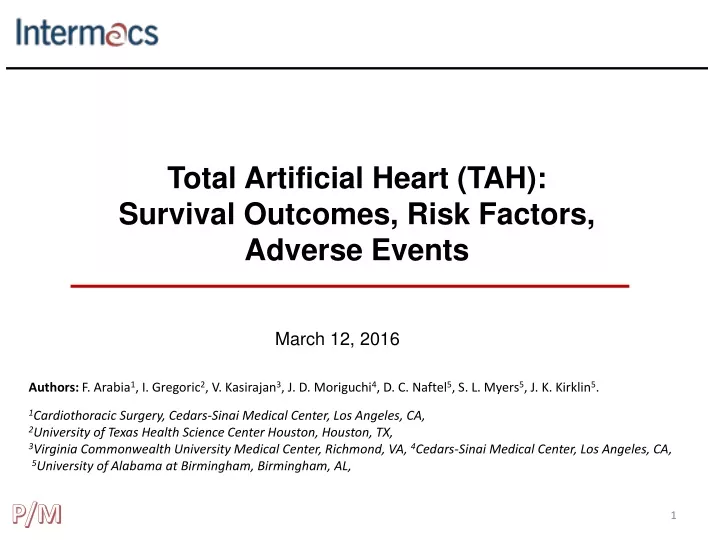
Total Artificial Heart (TAH): Survival Outcomes, Risk Factors, Adverse Events. March 12, 2016. Authors: F. Arabia 1 , I. Gregoric 2 , V. Kasirajan 3 , J. D. Moriguchi 4 , D. C. Naftel 5 , S. L. Myers 5 , J. K. Kirklin 5 .

E N D
Total Artificial Heart (TAH): Survival Outcomes, Risk Factors, Adverse Events March 12, 2016 Authors: F. Arabia1, I. Gregoric2, V. Kasirajan3, J. D. Moriguchi4, D. C. Naftel5, S. L. Myers5, J. K. Kirklin5. 1Cardiothoracic Surgery, Cedars-Sinai Medical Center, Los Angeles, CA, 2University of Texas Health Science Center Houston, Houston, TX, 3Virginia Commonwealth University Medical Center, Richmond, VA, 4Cedars-Sinai Medical Center, Los Angeles, CA, 5University of Alabama at Birmingham, Birmingham, AL, P/M
Implants June 2006 – March 2015: TAH – Survival Outcomes • Purpose • Outcomes: • Overall (comparison of TAH with LVAD recipients) • Patient selection across time by Era and Levels • Era • Risk factors • Implant volume P
TAH indications • Dilated (idiopathic) CM • Ischemic Cardiomyopathy • Valvular Cardiomyopathy • Hypertrophic (obstructive) CM • Hypertrophic (non-obstructive) • Restrictive Cardiomyopathy • Peripartum Cardiomyopathy • Ethylic Cardiomyopathy • Acute Myocardial Infarction • Post-Cardiopulmonary Bypass • Myocarditis • Acute Rejection – Donor Heart • Chronic Rejection – Donor Heart • Sarcoidosis • Amyloidosis • Malignant Arrhythmias • Adult and Pediatric Congenital • Ventricular Septal Defect • Ventricular Thrombus • LVAD/BiVAD Device Failure • Cardiac Tumors • Scleroderma • Mixed Cardiomyopathy • Chagas Disease • Non-ischemic Cardiomyopathy • Postcardiotomy Cardiogenic Shock • Endocarditis • Viral Cardiomyopathy • Familial Cardiomyopathy • Acute Type A Aortic Root Dissection
Implants June 2006 – March 2015: TAH – Survival Outcomes • Cohort Inclusion/Exclusion Criteria • Inclusions: Exclusions: • Syncardia TAH-t devices ■ Pediatrics ( < 19 years at implant) • Adults (age ≥ 19 years at implant) ■ No Informed consent • Implant dates: June 1, 2006 – March 31, 2015 • Follow-up date: March 31, 2015 • Study Group • Patients: 359 patients / 362 devices • Patient years: 148.86 • Total deaths with a device in place: 111 • Total heart transplants: 210 • Mean Follow-up (Months): 4.98 • Contributing Institutions: 44 P/M (txt)
Implants June 2006 – March 2015: Bi-VAD – Survival Outcomes Cohort All adult patients implanted From June 2006 through March 2015 N=15194 patients 16467implants Bi-VAD N= 863 (6%) 868 implants RVAD N=298 (2%) 341 implants TAH N= 359 (2%) 3 patients have a 2nd TAH implanted (n=362 TAH implants) LVAD N= 13674 (90%) 14896 implants • Comparison Group • Inclusion Criteria: • Primary CFLVAD • BTT: Listed • N=3473 Compare
“HOLD on to this Slide” Excerpt from INTERMACS Quarterly Report
Implants June 2006 – March 2015: TAH – Survival Outcomes TAH N= 359 2006-2009 2010-2012 2013-Mar 2015 Device Strategy at time of implant n ERA 1 ERA 2 ERA 3 Bridge to Transplant (patient currently listed for transplant) 224 (62.4%) 61 (73.5%) 85 (72.6%) 78 (49.1%) Possible Bridge to Transplant - Likely to be eligible 111 (30.9%) 18 (21.7%) 29 (24.8%) 64 (40.2%) Possible Bridge to Transplant - Moderate likelihood of becoming eligible 11 (3.1%) 2 (2.4%) 1 (0.9%) 8 (5.0%) Possible Bridge to Transplant - Unlikely to become eligible 6 (1.7%) 2 (2.4%) 1 (0.9%) 3 (1.9%) Destination Therapy (patient definitely not eligible for transplant) 3 (0.8%) 0 (0%) 0 (0%) 3 (1.9%) Rescue Therapy 3 (0.8%) 0 (0%) 1 (0.9%) 2 (1.3%) Other, specify 1 (0.3%) 0 (0%) 0 (0%) 1 (0.6%) Total 359 (100%) 83 (100%) 117 (100%) 159 (100%) 2006-2009 2010-2012 2013-Mar 2015 Intermacs Patient Profile Level at time of implant n Era 1 Era 2 Era 3 1 Critical Cardiogenic Shock 140 (39.0%) 38 (45.8%) 37 (31.6%) 65 (40.9%) 2 Progressive Decline 135 (37.6%) 35 (42.2%) 51 (43.6%) 49 (30.8%) 3 Stable but Inotrope Dependent 37 (10.3%) 3 (3.6%) 14 (12.0%) 20 (12.6%) 4 Resting Symptoms 21 (5.9%) 3 (3.6%) 8 (6.8%) 10 (6.3%) 5 Exertion Intolerant 5 (1.4%) 1 (1.2%) 0 (0%) 4 (2.5%) 7 Advanced NYHA Class 3 3 (0.8%) 1 (1.2%) 2 (1.7%) 0 (0%) Unspecified 18 (5.0%) 2 (2.4%) 5 (4.3%) 11 (6.9%) Total 359 (100%) 83 (100%) 117 (100%) 159 (100%)
Implants June 2006 – March 2015: TAH – Survival Outcomes • Comparison Group • Inclusion Criteria: • Primary CFLVAD • BTT: Listed • N=3473 2006-2009 2010-2012 2013-Mar 2015 Device Strategy at time of implant n ERA 1 ERA 2 ERA 3 Bridge to Transplant (patient currently listed for transplant) 3473 (100%) 672 (19.4%) 1261 (36.3) 1540 (44.3%) 2006-2009 2010-2012 2013-Mar 2015 Intermacs Patient Profile Level at time of implant n Era 1 Era 2 Era 3 1 Critical Cardiogenic Shock 433 (12.5%) 102 (15.2%) 168 (13.3%) 163 (10.6%) 2 Progressive Decline 1469 (42.3%) 323 (48.1%) 574 (45.5%) 572 (37.1%) 3 Stable but Inotrope Dependent 988 (28.5%) 149 (22.2%) 310 (24.6%) 529 (34.4%) 4 Resting Symptoms 398 (11.5%) 67 (10.0%) 155 (12.3%) 176 (11.4%) 5 Exertion Intolerant 81 (2.3%) 12 (1.8%) 28 (2.2%) 41 (2.7%) 6 Exertion Limited 26 (0.8%) 8 (1.2%) 13 (1.0%) 5 (0.3%) 7 Advanced NYHA Class 3 29 (0.8%) 11 (1.6%) 10 (0.8%) 8 (0.5%) Unspecified 49 (1.4%) 0 (0%) 3 (0.2%) 46 (3.0%) Total 3473 (100%) 672 (100%) 1261 (100%) 1540 (100%)
Implants June 2006 – March 2015: TAH – Survival Outcomes Comparison of TAH, n=359 and CFLVAD BTT: Listed, n=3473 % Patient Profile Levels
Implants June 2006 – March 2015: TAH – Survival Outcomes Comparison of TAH, n=359 and CFLVAD BTT: Listed, n=3473 Factors Associated with Right Heart Failure at time of implant
Implants June 2006 – March 2015: TAH – Survival Outcomes Comparison of TAH, n=359 and CFLVAD BTT: Listed, n=3473 Patient Illness characteristics at time of implant TAHCFLVAD/BTT Listed n=359 n=3473 Pre-implant Characteristics Mean±SD Mean±SD p-value Hemoglobin (mg/dL) 10.45 ± 2.1 11.48 ± 2.1 < .0001 LVEDD (cm) 6.31 ± 1.4 6.97 ± 1.1 < .0001 Platelet (K/uL) 180.93 ± 88.4 203.66 ± 78.6 < .0001 Pre-albumin (mg/dL) 15.64 ± 8.3 19.54 ± 7.6 < .0001 Right Atrial Pressure (mmHg) 17.26 ± 7.6 12.49 ± 7.9 < .0001
Implants June 2006 – March 2015: TAH – Survival Outcomes Comparison of TAH, n=359 and CFLVAD BTT: Listed, n=3473 Primary Diagnoses TAH CFLVAD/BTT Listed Primary Diagnosis n=359 n=3473 Cancer 2 (0.5%) 3 (0.1%) Ischemic Cardiomyopathy/Coronary Artery Disease 108 (30.1%) 1331 (38.3%) Dilated Myopathy: Post partum 3 (0.8%) 58 (1.7%) Dilated Myopathy: Viral 10 (2.8%) 103 (3.0%) Dilated Myopathy: All others 173 (48.2%) 1826 (52.6%) Hypertrophic Myopathy 11 (3.1%) 46 (1.3%) Restrictive Myopathy 22 (6.1%) 32 (0.9%) Valvular Heart Disease 14 (3.9%) 32 (0.9%) Congenital Heart Disease 10 (2.8%) 29 (0.8%) Not specified 6 (1.7%) 13 (0.4%) Totals 359 (100%) 3473 (100%)
Implants June 2006 – March 2015: TAH – Survival Outcomes Comparison of TAH, n=359 and CFLVAD BTT: Listed, n=3473 Primary Cause of Death CFLVAD/BTT Listed, n=3473 TAH (n=359) Primary Cause of Death Deaths = 515, % Deaths=111, % Nervous System: Neurological Dysfunction 110 21.36 20 18.01 Multisystem Organ Failure (MSOF) 64 12.43 39 35.14 Withdrawal of Support, specify 51 9.90 17 15.32 Major Infection 50 9.71 13 11.71 Circulatory: Other, Specify 30 5.83 3 2.70 Other, specify 29 5.63 2 1.80 Circulatory: Sudden Unexplained Death 28 5.44 0 0.00 Circulatory: Right Heart Failure 26 5.05 0 0.00 Circulatory: Cardiac Arrhythmia 21 4.08 0 0.00 Circulatory: CHF 19 3.69 2 1.80 Respiratory: Respiratory Failure 14 2.72 7 6.31 Device Malfunction 13 2.52 3 2.70 Circulatory: Major Bleeding 11 2.14 1 0.90 Circulatory: End Stage Cardiomyopathy 9 1.75 0 0.00 Digestive: Hepatic Dysfunction 6 1.17 2 1.80 Digestive: Renal Dysfunction 6 1.17 0 0.00 Other: Cancer 5 0.97 0 0.00 Circulatory: Ischemic Cardiomyopathy 4 0.78 0 0.00 Circulatory: Arterial Non-CNS Thromboembolism 3 0.58 0 0.00 Respiratory: Pulmonary: Other, specify 3 0.58 0 0.00 Other: Trauma/accident, specify 3 0.58 0 0.00 Circulatory: Myocardial Infarction 2 0.39 0 0.00 Not specified 2 0.39 0 0.00 Digestive: GI Disorder 1 0.19 1 0.90 Digestive: Fluid/Electrolyte Disorder 1 0.19 1 0.90 Circulatory: Hemolysis 1 0.19 0 0.00 Circulatory: Heart Disease 1 0.19 0 0.00 Hemotalogical 1 0.19 0 0.00 Cardiovascular, Other 1 0.19 0 0.00 Totals 515 100.00 111 100.00
Implants June 2006 – March 2015: TAH – Survival Outcomes TAH Implants: June 2006 – March 2015, n=359 N=359, deaths=111 % Survival at: 3 months 76% 6 months 65% 12 months 56% 24 months 41% % Survival Event: Death (censored at transplant or device exchange) Months post Implant
Implants June 2006 – March 2015: TAH – Survival Outcomes Primary CFLVAD-BTT:Listed implants: June 2006 – March 2015, n=3473 N=3473, deaths=515 % Survival at: 3 months 94% 6 months 92% 12 months 87% 24 months 80% % Survival Event: Death (censored at transplant or device exchange) Months post Implant
Implants June 2006 – March 2015: TAH – Survival Outcomes TAH Implants: June 2006 – March 2015, n=359 BY implant Era % Survival post implant at: Era n deaths 3 mths 6 mths 12 mths 2006-2009 83 18 81% 65% 54% 2010-2012 117 36 82% 70% 56% 2013-2015 159 57 70% 62% 56% P(overall) = .27 Era 1 vs Era 2: p=.80 Era 1 vs Era 3: p=.25 Era 2 vs Era 3: p=.13 % Survival Event: Death (censored at transplant or device exchange) Months post Implant
Implants June 2006 – March 2015: TAH – Survival Outcomes TAH Implants: June 2006 – March 2015, n=359 BY implant volume by Year* % Survival post implant at: Volume/Yr n deaths 3 mths 6 mths 12 mths 1-10 implants 245 92 71% 59% 46% ≥ 11 114 19 88% 80% 80% P = .0001 % Survival P?/M? Review this depiction with JKK/FP/DCN Event: Death (censored at transplant or device exchange) Months post Implant * Volume is calculated by year (average implants per hospital per year from enrollment)
Implants June 2006 – March 2015: TAH – Survival Outcomes N=3473, Primary CFLVAD BTT: listed for transplant Outcome % at: 6 months Alive (device in place) 71% Transplanted 20% Dead 8% Recovery 1% Transplanted Proportion of Patients Alive (on a device) Dead Recovery Months after Implant
Implants June 2006 – March 2015: TAH – Survival Outcomes N=359 TAH Outcome % at: 6 months Alive (device in place) 27% Transplanted 46% Dead 27% Transplanted Proportion of Patients Dead Alive (on a device) Months after Implant
Implants June 2006 – March 2015: TAH – Survival Outcomes N=3473, Primary CFLVAD BTT: listed for transplant N=359, TAH Outcome % at: 6 months Outcome % at: 6 months Alive (device in place) 71% Transplanted 20% Dead 8% Recovery 1% Alive (device in place) 27% Transplanted 46% Dead 27% Transplanted Proportion of Patients Alive (on a device) Dead Recovery Months after Implant
Implants June 2006 – March 2015: TAH – Survival Outcomes TAH: Center Volume (1-10 ), n= 245 N=43 centers Outcome % at: 6 months Alive (device in place) 27% Transplanted 40% Dead 33% Transplanted Proportion of Patients Dead Alive (on a device) Months after Implant
Implants June 2006 – March 2015: TAH – Survival Outcomes TAH: Center Volume (11+ ), n= 114 N=4 centers Outcome % at: 6 months Alive (device in place) 29% Transplanted 56% Dead 15% Transplanted Proportion of Patients Dead Alive (on a device) Months after Implant
Implants June 2006 – March 2015: TAH – Survival Outcomes Center Volume (1-10 ), n= 245 N=43 centers Center Volume (11+), n= 114 N=4 centers Outcome % at: 6 months Outcome % at: 6 months Alive (device in place) 27% Transplanted 40% Dead 33% Alive (device in place) 29% Transplanted 56% Dead 15% Transplanted Transplanted Proportion of Patients Dead Dead Alive (on a device) Alive (on a device) Months after Implant Monthsafter Implant
Implants June 2006 – March 2015: TAH – Survival Outcomes TO BE UPDATED BTT Listed (Not TAH), n= 4596 TAH, n=362 Events Patients Adverse Events n % n % Arterial Non-CNS Thromboembolism 15 0.8 13 3.6 Bleeding 442 22.3 171 47.2 Cardiac Arrhythmia 0 0.0 0 0.0 Device Malfunction 118 5.9 53 14.6 Hemolysis (as of 6/1/2014) 11 0.6 8 2.2 Hepatic Dysfunction 55 2.8 49 13.5 Hypertension (as of 6/1/2014) 29 1.5 23 6.4 Infection 462 23.3 197 54.4 Myocardial Infarction 0 0.0 0 0.0 Neurological Dysfunction 127 6.4 90 24.9 Other SAE 263 13.2 121 33.4 Pericardial Drainage 49 2.5 40 11.0 Psychiatric Episode 63 3.2 51 14.1 Renal Dysfunction 139 7.0 122 33.7 Respiratory Failure 191 9.6 130 35.9 Right Heart Failure (as of 6/1/2014) 1 0.01 1 0.3 Venous Thromboembolism 13 0.7 13 3.6 Wound Dehiscence 7 0.4 7 1.9 Totals 1985 100.00 Events Patients Adverse Events n % n % Arterial Non-CNS Thromboembolism 78 0.5 73 1.6 Bleeding 3316 19.9 1490 32.4 Cardiac Arrhythmia 1838 11.0 1182 25.7 Device Malfunction 1157 6.9 796 17.3 Hemolysis (as of 6/1/2014) 223 1.3 175 3.8 Hepatic Dysfunction 265 1.6 236 5.1 Hypertension (as of 6/1/2014) 175 1.0 145 3.2 Infection 3517 21.1 1850 40.3 Myocardial Infarction 21 0.1 21 0.5 Neurological Dysfunction 1019 6.1 771 16.8 Other SAE 2229 13.4 1188 25.8 Pericardial Drainage 268 1.6 231 5.0 Psychiatric Episode 430 2.6 358 7.8 Renal Dysfunction 601 3.6 504 11.2 Respiratory Failure 985 5.9 768 16.7 Right Heart Failure (as of 6/1/2014) 252 1.5 200 4.4 Venous Thromboembolism 241 1.4 215 4.7 Wound Dehiscence 61 0.4 56 1.2 Totals 16676 Note: This table does not consider patient exposure time.
Implants June 2006 – March 2015: TAH – Survival Outcomes TO BE UPDATED ** 50-60yrs of age was used * For 1 unit increase
TAH Trials • TAH 70 cc is FDA approved as BTT • In a trial for DT • TAH 50 cc in a Pediatric and Adult trials for BTT
Conclusion • More details at ISHLT • Centers familiar with the technology have good outcomes with the sickest patients.