Download
1 / 54
540 likes | 842 Vues
The Science of Global Warming. Andy Buddington SCC Earth Sciences Instructor. GLOBAL WHAT?. SCC Sasquatch Times, 2008. March, 2008. Warmest on record for global land surface temperature for month of March 2 nd warmest on record for whole Earth (land & oceans)

E N D
The Science of Global Warming Andy Buddington SCC Earth Sciences Instructor
GLOBAL WHAT? SCC Sasquatch Times, 2008
March, 2008 • Warmeston record for global land surface temperature for month of March • 2nd warmeston record for whole Earth (land & oceans) • National Climatic Data Center, April 18, 2008
The Science of GWKey Points • Greenhouse effect is real & essential • Natural climate variability & geologic time • Earth’s temp’s are indisputably warming • Anthropogenic GHG’s increasing • Observed & predicted effects of GW
Greenhouse Effect Greenhouse Effect process by which certain atmospheric gases trap heat thus warming and insulating the planet. Natural Greenhouse Gases • water vapor, carbon dioxide, methane, ozone
Greenhouse Effect & GHG’s • Essential in maintaining Earth’s “livable” temperature • “natural” GHG’s maintain ~59oF global temperature • Without natural GHG’s, ~3oF temperature • However……..
Climate Variability through Geologic Time Long Term vs. Short Term Climate Cycles • Long Term 10’s of millions of years • Short Term 10-100’s thousands of years Causes? • Long Term plate tectonics • Short Term orbital variations of planet
Earth’s Long-Term Climate Changes:Global “Ice Ages” (orange) vs. “Warm” episodes (blue)
Pleistocene: Short-Term Variations • Abundant evidence of major warm-cold fluctuations throughout the Pleistocene • Glacial advances vs. retreats • Minimum of 4 major advances (likely many more) till deposits, moraines, etc • Driven by orbital variations (Milankovitch cycles)
Ice Cores & Atmospheric Changes • Antarctica & Greenland cores record greenhouse gas concentrations • CO2, CH4, atmospheric dust, etc. • Ice core data correlate with geologic data
Antarctic Ice Core Data (Dome Concordia) Note ~100,000 cycle peaks of CO2 & CH4
Last 40,000 years, Modern Climate Note fluctuations from warm to cool but with overall warming
So, What Do We Know About The Present Climate Change Pattern?
Eight Warmest Years Worldwide(since the 1890’s) #1 2005 #2 1998 #3 2002 #4 2003 #5 2006 #6 2004 #7 2001 #8 1997 11 of the 12 warmest years have occurred since 1995! 20 of 21 warmest years have occurred since 1980!! (National Climatic Data Center, 2006)
January-September 2007 land temperature warmest on record!(National Climatic Data Center/October 16, 2007) For January-September, 2007, year to date: • the global land surface temperature ranked warmest on record • the Northern hemisphere land and land + ocean surface temperature ranked warmest on record • the combined global land + ocean surface temperature rankedfourthwarmest on record
“Global What?” (SCC Sasquatch Times) “Warming of the climate system is unequivocal, as is now evident from observations of increases in global average air and ocean temperatures, widespread melting of snow and ice, and rising global average sea level.” IPCC, 2007
Present Temperature Trends • Earth’s climate is changing! warming • Are the present temperature trends drastically different than geologic past? • YES! (unless Rush is right or you believe the Sasquatch Times)
What is Causing Present Temperature Trends? • What is forcing (driving) present day climate change global warming? • Natural or anthropogenic? • Role of Green House Gases critical water vapor, CO2, CH4, N2O, CFC’s
Keeling Curve of Atmospheric CO2 • CO2 is about 30% higher • CO2 rate of increase, 200 x faster than at any time in 650,000 years EPICA project leader Thomas Stocker, University of Bern
Changing GHG Levels in Atmosphere GHG1750 levelsPresent Increase CO2 280 ppm 384 ppm 29%* CH4 0.70 ppm 1.70 ppm 143% N20 280 ppb 360 ppb 11% * CO2 increase 200x faster than anytime in last 800,000 years!!!
The world's recent carbon dioxide emissions are growing more rapidly than even the worst-case climate scenario used by the Intergovernmental Panel on Climate Change (IPCC) C02 emissions from fossil fuels increasing at 3 times the rate of the 1990’s CDIAC & EIA data compared to IPCC CO2 rises exceed worst-case scenarios(Proceedings of the National Academy of Sciences/May 22, 2007)
Global mean surface temperature anomalies& simulations with natural forcings only(IPCC AR4, 2007/ The Physical Science Basis/p. 684, Fig. 9.5) Global mean surface temperature observations in black (anomalies relative to period 1901-1950) AOGCM simulation range in blue/mean in dark blue (58 simulations/14 models)
Global mean surface temperature anomalies& simulations with anthropogenic forcings(IPCC AR4, 2007/ The Physical Science Basis/p. 684, Fig. 9.5) Global mean surface temperature observations in black (anomalies relative to period 1901-1950) AOGCM simulation range in yellow/mean in red (58 simulations/14 models)
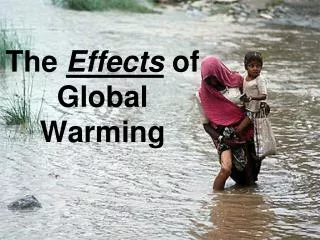
Measured & Anticipated Impacts • Impacts on the atmosphere • Impacts on the hydrosphere • Impacts on the cryosphere • Impacts on the geosphere • Impacts on the biosphere • Impacts on the anthroposphere
Global warming impacts on the atmosphere • Increasing air temperatures • Migration of climate zones • More extreme weather events • heat waves & droughts • intensified storms & floods
Global warming impacts on the hydrosphere • Impacts on sea surface temperatures • Impacts on ocean acidity (pH) • Impacts on sea level • Impacts on ocean circulation • Impacts on tropical storms • Impacts on rainfall and floods • Impacts on lakes
Projected Sea Level Rise Two main contributing factors • Warming ocean water expands, causing increased sea levels • Melting glaciers will deliver water to oceans • Present rate ~1inch/decade
Projected Sea Level Rise • Greenland ice sheet ~23’ rise in SL • West Antarctic ice sheet ~16’ rise • East Antarctic ice sheet ~190’ rise
Ocean acidity studies: ocean acidity (pH level) is changing • ocean pH stable from 1000 to 1800 years • drop of 0.1 of a pH unit from 8.16 to 8.05 (since the industrial revolution) • Predicted 0.3-0.4drop by 2100 RESULT reduced carbonate uptake by CaCO3 secreting organisms plankton, coral, etc.
Global warming impacts on the cryosphere • Impacts on Arctic sea ice • Impacts on Greenland • Impacts on permafrost & tundra • Impacts on Antarctica • Impacts on mountain glaciers
September Arctic sea ice at record low(NASA/Earth Observatory/September 16, 2007) Arctic sea ice reached a record low in September 2007, below the previous record set in 2005 (23% less) and substantially below the long-term average
Greenland melt zone 1979-2002(Arctic Climate Impact Assessment, 2004) *Greenland has warmed 7.2oF since 1991
NASA GRACE satellite detects significant Antarctic ice mass loss(University of Colorado/March 2, 2006) (photo courtesy British Antarctic Survey) Isabella Velicogna and John Wahr of the University of Colorado (Boulder) demonstrated for the first time that Antarctica's ice sheet lost a significant amount of mass since the launch of GRACE [Gravity Recovery and Climate Experiment] in 2002. RELEASE: 06-085
An area stretching for a million square kilometers across the permafrost of western Siberia is turning into a mass of shallow lakes as the ground melts. The sudden melting of a bog the size of France and Germany could unleash billions of tons of methane, a potent greenhouse gas. Sergei Kirpotin of Tomsk State University describes an "ecological landslide that is probably irreversible and is undoubtedly connected to climatic warming.“ Western Siberia has warmed some 3 °C in the last 40 years. (photo courtesy of BBC News) Global warming impacts on permafrost & tundraWestern Siberia thawing for the first time in 11,000 years(New Scientist/August 11, 2005)
Permafrost Carbon • Researchers estimate ~1000 gigatons of carbon in world’s permafrost • Humanity 6.5 gigatons/year • Permafrost carbon methane (CH4) • CH4 21 times more “powerful” GHG!
(photo by Dan Crosbie) Polar bears cannot survive without sea ice and, in all likelihood, summer sea ice will be gone from the north polar basin within the next few decades (Center for Biological Diversity 6/15/06) Given the rapid pace of ecological change in the Arctic, the long generation time and highly specialized nature of polar bears, it is unlikely that polar bears will survive as a species if the sea ice disappears Melting sea ice stresses polar bears(Integrative and Comparative Biology/April, 2004)
Global warming impacts on the anthroposphere • Impacts on communities and ecosystems • Impacts on water and agriculture • Impacts on disease and health
Is Today’s Global Warming Different? Is Today’s Warming Trend Any More Significant Than The Past? Is Today’s Warming Serious?
“We have a very brief window of opportunity”Dr. James Hansen, Director, NASA Goddard Institute for Space Studies “We have a very brief window of opportunity to deal with climate change . . . no longer than a decade at the most.“ If the world continues with "business as usual," temperatures will rise by 2 to 3o Celsius (3.6 to 7.2o F) and"we will be producing a different planet"