Download
1 / 1
20 likes | 213 Vues
Solvent - free microwave synthesis and DFT characterization of some 1,4- diketones Dilek Elmalı, Ferda İslam Anadolu University, Faculty of Sciences, Department of Chemistry, Eskisehir, Turkey.

E N D
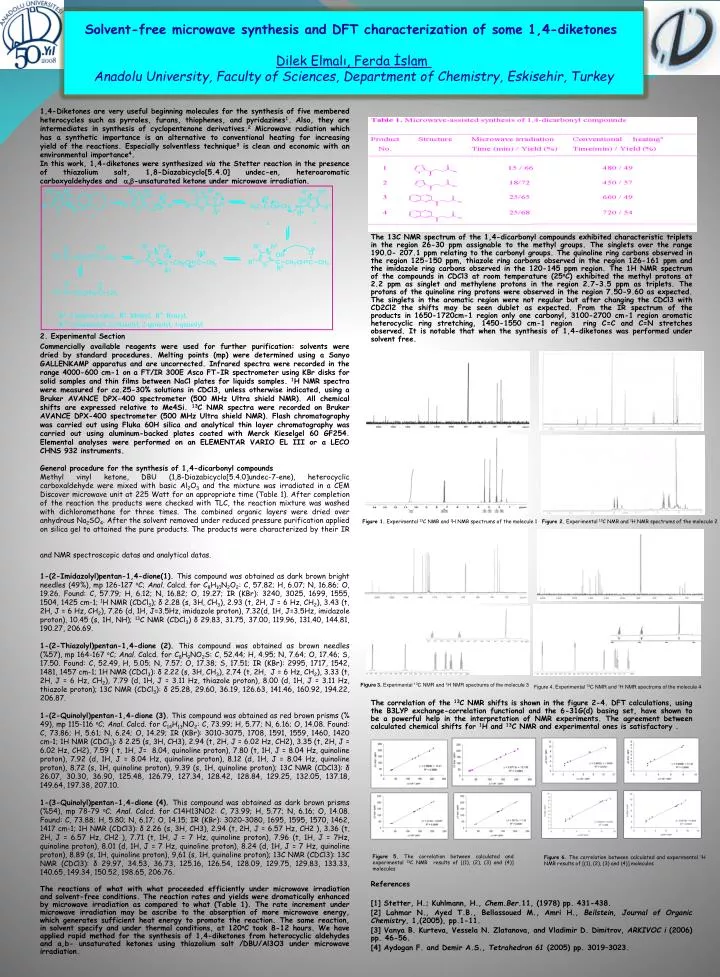
Solvent-freemicrowavesynthesisand DFT characterization of some 1,4-diketones Dilek Elmalı, Ferda İslamAnadolu University, Faculty of Sciences, Department of Chemistry, Eskisehir, Turkey 1,4-Diketones are very useful beginning molecules for the synthesis of five membered heterocycles such as pyrroles, furans, thiophenes, and pyridazines1. Also, they are intermediates in synthesis of cyclopentenone derivatives.2 Microwave radiation which has a synthetic importance is an alternative to conventional heating for increasing yield of the reactions. Especially solventless technique3 is clean and economic with an environmental importance4. In this work, 1,4-diketones were synthesized via the Stetter reaction in the presence of thiazolium salt, 1,8-Diazabicyclo[5.4.0] undec-en, heteroaromatic carboxyaldehydes and a,b-unsaturated ketone under microwave irradiation. 2. Experimental Section Commercially available reagents were used for further purification: solvents were dried by standard procedures. Melting points (mp) were determined using a Sanyo GALLENKAMP apparatus and are uncorrected. Infrared spectra were recorded in the range 4000-600 cm-1 on a FT/IR 300E Asco FT-IR spectrometer using KBr disks for solid samples and thin films between NaCl plates for liquids samples. 1H NMR spectra were measured for ca.25-30% solutions in CDCl3, unless otherwise indicated, using a Bruker AVANCE DPX-400 spectrometer (500 MHz Ultra shield NMR). All chemical shifts are expressed relative to Me4Si. 13C NMR spectra were recorded on Bruker AVANCE DPX-400 spectrometer (500 MHz Ultra shield NMR). Flash chromatography was carried out using Fluka 60H silica and analytical thin layer chromatography was carried out using aluminum-backed plates coated with Merck Kieselgel 60 GF254. Elemental analyses were performed on an ELEMENTAR VARIO EL III or a LECO CHNS 932 instruments. General procedure for the synthesis of 1,4-dicarbonyl compounds Methyl vinyl ketone, DBU (1,8-Diazabicyclo[5.4.0]undec-7-ene), heterocyclic carboxaldehyde were mixed with basic Al2O3 and the mixture was irradiated in a CEM Discover microwave unit at 225 Watt for an appropriate time (Table 1). After completion of the reaction the products were checked with TLC, the reaction mixture was washed with dichloromethane for three times. The combined organic layers were dried over anhydrous Na2SO4. After the solvent removed under reduced pressure purification applied on silica gel to attained the pure products. The products were characterized by their IR and NMR spectroscopic datas and analytical datas. 1-(2-Imidazolyl)pentan-1,4-dione(1). This compound was obtained as dark brown bright needles (49%), mp 126-127 oC; Anal. Calcd. for C8H10N2O2: C, 57.82; H, 6.07; N, 16.86; O, 19.26. Found: C, 57.79; H, 6.12; N, 16.82; O, 19.27; IR (KBr): 3240, 3025, 1699, 1555, 1504, 1425 cm-1; 1H NMR (CDCl3); δ 2.28 (s, 3H, CH3), 2.93 (t, 2H, J = 6 Hz, CH2), 3.43 (t, 2H, J = 6 Hz, CH2), 7.26 (d, 1H, J=3.5Hz, imidazole proton), 7.32(d, 1H, J=3.5Hz, imidazole proton), 10.45 (s, 1H, NH); 13C NMR (CDCl3) δ 29.83, 31.75, 37.00, 119.96, 131.40, 144.81, 190.27, 206.69. 1-(2-Thiazolyl)pentan-1,4-dione (2). This compound was obtained as brown needles (%57), mp 164-167 oC; Anal. Calcd. for C8H9NO2S: C, 52.44; H, 4.95; N, 7.64; O, 17.46; S, 17.50. Found: C, 52.49, H, 5.05; N, 7.57; O, 17.38; S, 17.51; IR (KBr): 2995, 1717, 1542, 1481, 1457 cm-1; 1H NMR (CDCl3): δ 2.22 (s, 3H, CH3), 2.74 (t, 2H, J = 6 Hz, CH2), 3.33 (t, 2H, J = 6 Hz, CH2), 7.79 (d, 1H, J = 3.11 Hz, thiazole proton), 8.00 (d, 1H, J = 3.11 Hz, thiazole proton); 13C NMR (CDCl3): δ 25.28, 29.60, 36.19, 126.63, 141.46, 160.92, 194.22, 206.87. 1-(2-Quinolyl)pentan-1,4-dione (3).This compound was obtained as red brown prisms (% 49), mp 115-116 oC; Anal. Calcd. for C14H13NO2: C, 73.99; H, 5.77; N, 6.16; O, 14.08. Found: C, 73.86; H, 5.61; N, 6.24; O, 14.29; IR (KBr): 3010-3075, 1708, 1591, 1559, 1460, 1420 cm-1; 1H NMR (CDCl3): δ 2.25 (s, 3H, CH3), 2.94 (t,2H, J = 6.02 Hz, CH2), 3.35 (t, 2H, J = 6.02 Hz, CH2), 7.59 ( t, 1H, J= 8.04, quinoline proton), 7.80 (t, 1H, J = 8.04 Hz, quinoline proton), 7.92 (d, 1H, J = 8.04 Hz, quinoline proton), 8.12 (d, 1H, J = 8.04 Hz, quinoline proton), 8.72 (s, 1H, quinoline proton), 9.39 (s, 1H, quinoline proton); 13C NMR (CDCl3): δ 26.07, 30.30, 36.90, 125.48, 126.79, 127.34, 128.42, 128.84, 129.25, 132.05, 137.18, 149.64, 197.38, 207.10. 1-(3-Quinolyl)pentan-1,4-dione (4). This compound was obtained as dark brown prisms (%54),mp 78-79 oC; Anal. Calcd. for C14H13NO2: C, 73.99; H, 5.77; N, 6.16; O, 14.08. Found: C, 73.88; H, 5.80; N, 6.17; O, 14.15; IR (KBr): 3020-3080, 1695, 1595, 1570, 1462, 1417 cm-1; 1H NMR (CDCl3): δ 2.26 (s, 3H, CH3), 2.94 (t, 2H, J = 6.57 Hz, CH2 ), 3.36 (t, 2H, J = 6.57 Hz, CH2 ), 7.71 (t, 1H, J = 7 Hz, quinoline proton), 7.96 (t, 1H, J = 7Hz, quinoline proton), 8.01 (d, 1H, J = 7 Hz, quinoline proton), 8.24 (d, 1H, J = 7 Hz, quinoline proton), 8.89 (s, 1H, quinoline proton), 9,61 (s, 1H, quinoline proton); 13C NMR (CDCl3): 13C NMR (CDCl3): δ 29.97, 34.53, 36.73, 125.16, 126.54, 128.09, 129.75, 129.83, 133.33, 140.65, 149.34, 150.52, 198.65, 206.76. The reactions of what with what proceeded efficiently under microwave irradiation and solvent-free conditions. The reaction rates and yields were dramatically enhanced by microwave irradiation as compared to what (Table 1). The rate increment under microwave irradiation may be ascribe to the absorption of more microwave energy, which generates sufficient heat energy to promote the reaction. The same reaction, in solvent specify and under thermal conditions, at 120oC took 8-12 hours. We have applied rapid method for the synthesis of 1,4-diketones from heterocyclic aldehydes and a,b- unsaturated ketones using thiazolium salt /DBU/Al3O3 under microwave irradiation. The 13C NMR spectrum of the 1,4-dicarbonylcompoundsexhibitedcharacteristictriplets in theregion 26-30 ppmassignabletothemethylgroups. Thesingletsovertherange 190.0- 207.1 ppmrelatingtothecarbonylgroups. Thequinoline ring carbonsobserved in theregion 125-150 ppm, thiazole ring carbonsobserved in theregion 126-161 ppmandtheimidazole ring carbonsobserved in the 120-145 ppmregion. The 1H NMR spectrum of thecompounds in CDCl3 at roomtemperature (25oC) exhibitedthemethylprotons at 2.2 ppm as singletandmethyleneprotons in theregion 2.7-3.5 ppm as triplets. Theprotons of thequinoline ring protonswereobserved in theregion 7.50-9.60 as expected. Thesinglets in thearomaticregionwere not regular but afterchangingthe CDCl3 with CD2Cl2 theshiftsmay be seendublet as expected. Fromthe IR spectrum of theproducts in 1650-1720cm-1 regiononlyonecarbonyl, 3100-2700 cm-1 regionaromaticheterocyclic ring stretching, 1450-1550 cm-1 region ring C=C and C=N stretchesobserved. It is notablethatwhenthesynthesis of 1,4-diketoneswasperformedundersolventfree. Thecorrelation of the13C NMR shifts is shown in thefigure 2-4. DFT calculations, usingthe B3LYP exchange-correlationfunctionalandthe 6-31G(d) basing set, haveshownto be a powerfulhelp in theinterpretation of NMR experiments. Theagreementbetweencalculatedchemicalshiftsfor1H and13C NMR andexperimentalones is satisfactory . References [1] Stetter, H.; Kuhlmann, H., Chem.Ber.11, (1978) pp. 431-438. [2] Lahmar N., Ayed T.B., Bellassoued M., Amri H., Beilstein, Journal of OrganicChemistry, 1,(2005), pp.1-11. [3]Vanya B. Kurteva, Vessela N. Zlatanova, andVladimir D. Dimitrov, ARKIVOC i (2006) pp. 46-56. [4] Aydogan F. and Demir A.S., Tetrahedron 61 (2005) pp. 3019–3023. Figure 1. Experimental 13C NMR and 1H NMR spectrums of the molecule 1 Figure 2.Experimental13C NMR and1H NMR spectrums of themolecule 2 Figure 3. Experimental 13C NMR and 1H NMR spectrums of the molecule 3 Figure 4. Experimental 13C NMR and 1H NMR spectrums of the molecule 4 Figure 5. The correlation between calculated and experimental 13C NMR results of [(1), (2), (3) and (4)] molecules Figure 6. The correlation between calculated and experimental 1H NMR results of [(1), (2), (3) and (4)] molecules