Download
1 / 36
360 likes | 462 Vues
Task Force Submitters LFG Analysis. Children’s Hospitals Taskforce October 2007. Objective. Provide Snapshot of Children’s Hospital vs. National Results Identify Gaps and Obtain Feedback Provide Context for Adoption Simulator Submission. Summary of Findings.

E N D
Task Force Submitters LFG Analysis Children’s Hospitals Taskforce October 2007
Objective • Provide Snapshot of Children’s Hospital vs. National Results • Identify Gaps and Obtain Feedback • Provide Context for Adoption Simulator Submission
Summary of Findings • 10 Organizations Submitted to the TMIT Survey • Average 721 Points out of 1,000 • National Average is 706 • Range 918 – 492 Points
Distribution of Sample n Survey Score
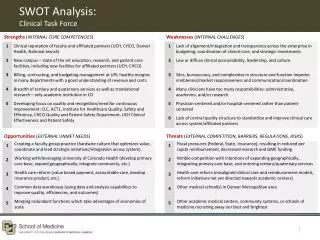
Summary of Findings • Strengths: • “As” Action (“Strongest” of the 4 As) • Safe Practices (Above National Average) • SP# 1.1 – Culture of Safety (+11%) • SP# 2 – Informed Consent (+12%) • SP# 4 – Disclosure (+17%) • SP# 17 – Perioperative Myocardial Ischemia Prevention (+11%) • SP# 20 – BSI (+16%) • SP# 22 – Hand Hygiene (+13%) • SP# 25 – Wrong-Site (+17%)
Summary of Findings • Gaps were Identified: • “As” Accountability (Weakest of the 4 As) • Safe Practices (below National Average) • SP# 15 – Pharmacists’ Role (-6%) • SP# 19 – Risk of Aspiration (-8%) • SP# 26 – Perioperative Myocardial Ischemia Prevention (-36%) • SP# 28 – DVT/VTE Prevention (-31%) • SP# 29 – Anticoagulation Therapy (-17%)
Culture of Safety: Practice 1 Element 1 – 120 Points 100 90 80 73% 70 62% Nat’l. Avg. 62% 60 50 40 30 20 10 0 Children’s Hospitals National Average
Culture of Safety: Practice 1 Element 2 – 20 Points 100 90 80 68% 68% Nat’l. Avg. 67% 70 62% Natl. Avg. 60 50 40 30 20 10 0 Children’s Hospitals National Average
Culture of Safety: Practice 1 Element 3 – 40 Points 100 90 80 70 62% Natl. Avg. 58% 58% 58% Nat’l. Avg. 60 50 40 30 20 10 0 Children’s Hospitals National Average
Culture of Safety: Practice 1 Element 4 – 120 Points 100 90 80 74% 73% 73% Nat’l. Avg. 70 60 50 40 30 20 10 0 Children’s Hospitals National Average
Informed Consent: Practice 2 – 4 Points 100 90 80 70 62% Natl. Avg. 59% 60 47% 47% Nat’l. Avg. 50 40 30 20 10 0 Children’s Hospitals National Average
Life-Sustaining Treatment: Practice 3 – 4 Points 100 90 80 70 62% Natl. Avg. 58% 60 51% 51% Nat’l. Avg. 50 40 30 20 10 0 Children’s Hospitals National Average
Disclosure: Practice 4 – 25 Points 100 90 85% 80 68% 68% Nat’l. Avg. 70 62% Natl. Avg. 60 50 40 30 20 10 0 Children’s Hospitals National Average
Nursing Workforce: Practice 5 – 100 Points 100 90 78% 75% 78% Nat’l. Avg. 80 70 62% Natl. Avg. 60 50 40 30 20 10 0 Children’s Hospitals National Average
Direct Caregivers Workforce: Practice 6 – 20 Points 100 90 80 66% 70 63% 63% Nat’l. Avg. 62% Natl Avg. 60 50 40 30 20 10 0 Children’s Hospitals National Average
Critical Care Information: Practice 8 – 84 Points 100 90 80 75% 69% 69% Nat’l. Avg. 70 62% Natl. Avg. 60 50 40 30 20 10 0 Children’s Hospitals National Average
Order Read-back: Practice 9 – 25 Points 100 90 80 73% 71% 73% Nat’l. Avg. 70 60 50 40 30 20 10 0 Children’s Hospitals National Average
Labeling Studies: Practice 10 – 15 Points 100 90 78% 80 70% 70% Nat’l. Avg. 70 60 50 40 30 20 10 0 Children’s Hospitals National Average
Discharge System: Practice 11 – 25 Points 100 90 80 75% 69% 69% Nat’l. Avg. 70 62% Natl. Avg. 60 50 40 30 20 10 0 Children’s Hospitals National Average
Abbreviations: Practice 13 – 11 Points 100 90 85% 82% 82% Nat’l. Avg. 80 70 62% Natl. Avg. 60 50 40 30 20 10 0 Children’s Hospitals National Average
Medication Reconciliation: Practice 14 – 35 Points 100 90 85% 83% 83% Nat’l. Avg. 80 70 62% Natl. Avg. 60 50 40 30 20 10 0 Children’s Hospitals National Average
Pharmacists’ Role: Practice 15 – 32 Points 100 90 81% 81% Nat’l. Avg. 80 74% 70 62% Natl. Avg. 60 50 40 30 20 10 0 Children’s Hospitals National Average
Standardized Medication Labeling & Packaging: Practice 16 – 20 Points 100 90 80 74% 71% 71% Nat’l. Avg. 70 62% Natl. Avg. 60 50 40 30 20 10 0 Children’s Hospitals National Average
High-Alert Medications: Practice 17 – 20 Points 100 90 84% 80 73% 73% Nat’l. Avg. 70 62% Natl. Avg. 60 50 40 30 20 10 0 Children’s Hospitals National Average
Unit-Dose Medications: Practice 18 – 25 Points 100 90 80 68% 68% Nat’l. Avg. 70 62% 62% Natl. Avg. 60 50 40 30 20 10 0 Children’s Hospitals National Average
Risk of Aspiration & VAP Prevention: Practice 19 – 20 Points 100 90 82% 82% Nat’l. Avg. 80 74% 70 62% Natl. Avg. 60 50 40 30 20 10 0 Children’s Hospitals National Average
Central Venous Catheter Blood Stream Infection Prevention: Practice 20 – 30 Points 100 95% 90 80% 80% Nat’l. Avg. 80 70 62% Natl. Avg. 60 50 40 30 20 10 0 Children’s Hospitals National Average
Surgical-Site Infection: Practice 21 – 30 Points 100 90 84% 84% Nat’l. Avg. 79% 80 70 62% Natl. Avg. 60 50 40 30 20 10 0 Children’s Hospitals National Average
Hand Hygiene: Practice 22 – 30 Points 100 94% 90 81% 81% Nat’l. Avg. 80 70 62% Natl. Avg. 60 50 40 30 20 10 0 Children’s Hospitals National Average
Influenza Protection: Practice 23 – 10 Points 100 90 82% 76% 80 76% Nat’l. Avg. 70 60 50 40 30 20 10 0 Children’s Hospitals National Average
Wrong-site Surgical Prevention: Practice 25 – 20 Points 100% 100 90 83% 83% Nat’l. Avg. 80 70 62% Natl. Avg. 60 50 40 30 20 10 0 Children’s Hospitals National Average
Perioperative Myocardial Ischemia/Infarct Prevention: Practice 26 – 20 Points 100 90 80 70 62% Natl. Avg. 60 51% 51% Nat’l. Avg. 50 40 30 20 15% 10 0% 0 Children’s Hospitals National Average
Pressure Ulcer Prevention: Practice 27 – 25 Points 100 90 84% 77% 77% Nat’l. Avg. 80 70 60 50 40 30 20 10 0 Children’s Hospitals National Average
DVT/VTE Prevention: Practice 28 – 25 Points 100 90 80 70 63% 63% Nat’l. Avg. 60 50 40 31% 30 20 10 0 Children’s Hospitals National Average
Anticoagulation Therapy: Practice 29 – 35 Points 100 90 80 70 62% Natl. Avg. 60 51% 51% Nat’l. Avg. 50 40 34% 30 20 10 0 Children’s Hospitals National Average
Contrast Media-induced Renal Failure: Practice 30 – 10 Points 100 90 80 70 65% 62% 62% Nat’l. Avg. 62% Natl. Avg. 60 50 40 30 20 10 0 Children’s Hospitals National Average