Download
1 / 77
770 likes | 901 Vues
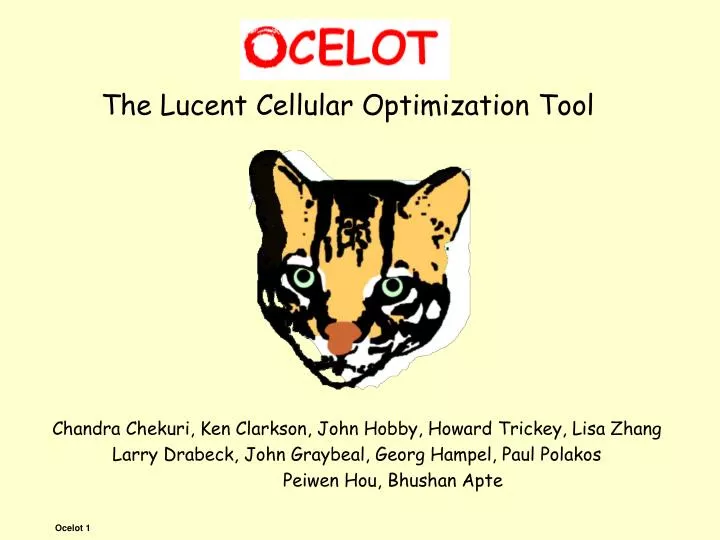
The Lucent Cellular Optimization Tool. Chandra Chekuri, Ken Clarkson, John Hobby, Howard Trickey, Lisa Zhang Larry Drabeck, John Graybeal, Georg Hampel, Paul Polakos Peiwen Hou, Bhushan Apte. Why “Ocelot”?. .*w.*o.*t.* blowout bowknot figwort madwort ragwort ribwort rowboat swot swotted

E N D
The Lucent Cellular Optimization Tool Chandra Chekuri, Ken Clarkson, John Hobby, Howard Trickey, Lisa Zhang Larry Drabeck, John Graybeal, Georg Hampel, Paul Polakos Peiwen Hou, Bhushan Apte
Why “Ocelot”? • .*w.*o.*t.* blowout bowknot figwort madwort ragwort ribwort rowboat swot swotted • .*t.*c.*o.* outcome outcrop portico stucco stuccos taco tacos taction talcose tobacco • .*t.*ce.*o.* trecento • .*t.*o.*ce.* thoraces toepiece trounce twopence • .*ce.*.*op.* acetophenetidin cellophane cephalopod cephalopodan mycetophagous • .*op.*ce.* copacetic coparcenary coparcener coppice opalescence opalescent opulence populace • .*s.*ce.*o.* saucebox scenario seicento • .*ce.*p.*t.* centripetal centripetally cephalization cephalometry cephalothorax chemoreception chemoreceptive concept cesspit
The Problem • We want to tune cellular systems for: • Contract requirements • Peak performance
We can change: • Antenna Power • Antenna Tilt (with difficulty) • Antenna Azimuth (ditto) • (GSM) frequency plan • Not antenna location • Plausible for a metropolitan area market.
Current Practice: Drivetests • Drive around making measurements • adjust some parameters • repeat until done
Ocelot Approach • Model system numerically • Compute performance measures for model • Numerically optimize performance
OCELOTOptimization Ocelot-Optimized Design Coverage: 98% Initial Design Coverage: 84% Uncovered Areas. Covered Areas. Sectors colors: Tilt 00 7 0
Performance measures • Coverage • should serve all of market, without “holes” • Capacity • should serve as many calls as possible • There is a tradeoff between these two goals
Low Coverage High Coverage High Pilot Pollution in Center => Large Coverage Hole Reduced Pilot Pollution in Center: => Small Coverage Holes Cells have equal traffic load => High Effective Network Capacity Traffic load unbalanced => Small Effective Network Capacity High Capacity Low Capacity Max Coverage vs. Max Capacity Network coverage and network capacity cannot be optimized at the same time =>Example: 5-Cell Scenario Large Antenna Tilt Small
Max Capacity Max Coverage Compromise Capacity vs. Coverage 50% 3%
Demo of OCELOT in Action • Optimization of a CDMA Market
Sectors colors: Tilt 00 7 0 CELLS OF WIRELESS NETWORK
Sectors colors: Tilt 00 7 0 OCELOT COVERAGE OPTIMIZATION STARTS
Sectors colors: Tilt 00 7 0 INITIAL COVERAGE 98 82 84 86 88 90 92 94 96 100 %
Sectors colors: Tilt 00 7 0 98 82 84 86 88 90 92 94 96 100 %
Sectors colors: Tilt 00 7 0 98 82 84 86 88 90 92 94 96 100 %
Sectors colors: Tilt 00 7 0 98 82 84 86 88 90 92 94 96 100 %
Sectors colors: Tilt 00 7 0 98 82 84 86 88 90 92 94 96 100 %
Sectors colors: Tilt 00 7 0 98 82 84 86 88 90 92 94 96 100 %
Sectors colors: Tilt 00 7 0 98 82 84 86 88 90 92 94 96 100 %
Sectors colors: Tilt 00 7 0 98 82 84 86 88 90 92 94 96 100 %
Sectors colors: Tilt 00 7 0 98 82 84 86 88 90 92 94 96 100 %
Sectors colors: Tilt 00 7 0 98 82 84 86 88 90 92 94 96 100 %
Sectors colors: Tilt 00 7 0 98 82 84 86 88 90 92 94 96 100 %
Sectors colors: Tilt 00 7 0 98 82 84 86 88 90 92 94 96 100 %
Sectors colors: Tilt 00 7 0 98 82 84 86 88 90 92 94 96 100 %
Sectors colors: Tilt 00 7 0 98 82 84 86 88 90 92 94 96 100 %
Sectors colors: Tilt 00 7 0 98 82 84 86 88 90 92 94 96 100 %
Sectors colors: Tilt 00 7 0 98 82 84 86 88 90 92 94 96 100 %
Sectors colors: Tilt 00 7 0 98 82 84 86 88 90 92 94 96 100 %
Sectors colors: Tilt 00 7 0 98 82 84 86 88 90 92 94 96 100 %
Sectors colors: Tilt 00 7 0 98 82 84 86 88 90 92 94 96 100 %
Sectors colors: Tilt 00 7 0 98 82 84 86 88 90 92 94 96 100 %
Sectors colors: Tilt 00 7 0 98 82 84 86 88 90 92 94 96 100 %
Sectors colors: Tilt 00 7 0 98 82 84 86 88 90 92 94 96 100 %
Sectors colors: Tilt 00 7 0 98 82 84 86 88 90 92 94 96 100 %
Sectors colors: Tilt 00 7 0 98 82 84 86 88 90 92 94 96 100 %
Sectors colors: Tilt 00 7 0 FINAL COVERAGE 98 82 84 86 88 90 92 94 96 100 %
Sectors colors: Tilt 00 7 0 Initial Design INITIAL COVERAGE 98 82 84 86 88 90 92 94 96 100 %
Sectors colors: Tilt 00 7 0 Ocelot Optimized Design FINAL COVERAGE 98 82 84 86 88 90 92 94 96 100 %
OCELOT Performance • Significant Performance Improvements using Ocelot • Coverage : 5% to 20% • Capacity : 20% to 80% • Field trials have Demonstrated Ocelot Optimization is Superior to Drive Test Optimization • Ocelot successfully used worldwide • Used in ~30 CDMA IS95 markets • Used in ~10 GSM markets • Demo UMTS markets
Technical Challenges • Traffic modeling (pattern of calls) • Predicting pathlosses (signal strengths) • Modeling network performance • Hard: phones and base-stations interact • Computing derivatives (for optimization) • User interface should be: • Robust to errors • Responsive while computing
Outline • Traffic modeling and meshes • CDMA system modeling • Reverse-link interference and power control • Power amplifier sharing • The GUI • Theme: many applications of algorithmic ideas
Traffic modeling • Phone traffic pattern is modeled with a “mesh” • planar graph • Evaluate system based on calls from mesh edges • Mesh is from a street map (if available) • Street map density is roughly population density • People make calls from cars • Edges of mesh also have traffic weights
Geometric operations • Import maps • Map overlay: line segment intersection • Clipping against polygons • user supplied, or • “Autoboundary”
Autoboundary • Base-station locations imply phone traffic density • Code: • find a-shape • Minkowski sum with square • Cull