Download
1 / 11
110 likes | 264 Vues
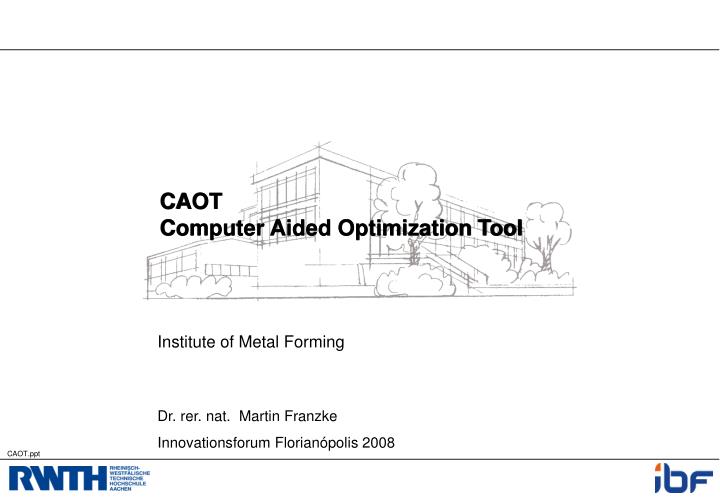
CAOT Computer Aided Optimization Tool. Institute of Metal Forming. Dr. rer. nat. Martin Franzke Innovationsforum Florianópolis 2008. Outline. C omputer A ided O ptimization (CAO) Introduction of CAOT ( C omputer A ided O ptimization T ool) Optimization of a drawing process

E N D
CAOTComputer Aided Optimization Tool Institute of Metal Forming Dr. rer. nat. Martin Franzke Innovationsforum Florianópolis 2008
Outline • Computer Aided Optimization (CAO) • Introduction of CAOT (Computer Aided Optimization Tool) • Optimization of a drawing process • Optimization of a process chain • Summary
automatic evaluation target function value automatic optimizationprocedure combinatorial optimization methods Computer Aided Optimization (CAO) job new input data process model simulation program execution variation evaluation results
m Z(p1, ..., pn)=Swk · penk(resk) k=1 Evaluation of target function value simulation res1 res2 resm results penalty terms pen1(res1) pen2(res2) penm(resm) w1· pen1(res1) w2· pen2(res2) wm· penm(resm) weighting target functionvalue 2 whereas penk(resk) = |desired value (resk) – actual value (resk) |
force [0..200] temperature [0..800] 250 kN 912°C variance of 25% 625 variance of 14% 196 weight 1 625 weight 10 1960 z = 625 + 1960 = 2585 Evaluation of target function value – example simulation results penalty terms weighting target function value
eij, sij a R d1 v z d0 lz Optimization of a drawing process Range/Initial Design parameter [1-6] / 3 [4-10] / 6 [3-30] / 15 Length of parallel lz Angle of inclination of drawing hole a Transition radius R
Optimization of a drawing process 966,68 N/mm2 - 613,22 N/mm2 LARSTRAN/Shape Optimization objective: Decrease the tensile stress near the surface without decreasing the compressive strain in the middle of the wire essential by variation of the design parameters Restrictions: Range for tensile stress [0..800 N/mm2], range for compressive stress [-800..-600 N/mm2]
Optimization of a drawing process optimized CAOTLARSTRAN/Shape 783,10 N/mm2 966,68 N/mm2 - 713,66 N/mm2 - 613,22 N/mm2 initial configuration
Optimization of a process chain Initial blank flexible rolling cutting HBU cutting loading
thickness [mm] Blechdicke in mm bending [mm] 1.400 1.500 1.367 0.916 1.333 0.333 1.300 -0.250 1.267 -0.833 1.233 -1.417 1.200 -2.000 Optimization of a process chain Optimization objective:Minimal bending under loading! Restriction:Weight less than 100%! blank with constant thickness Ta i lor Rolled Blank sheet thickness 1,4 0,8 1,2 – 1,4 1,2 – 1,4 2,55 (100%) 10,23 (400%) 1,48 (58%) bending 2,81 (110%) weight 100% 57% 80% 95% The maximum bending of the optimized component is 58% and the weight is 95% compared to the initial configuration!
Summary • Automatic optimization of metal forming processes is applicable • The basic condition is to use a process model which covers the real process exactly • The computing time is still high in the case of using 3D-FEM • In the case of elementary or empirical models the introduced optimization system can deliver very fast significant process improvement