Download
1 / 18
190 likes | 428 Vues
Hypothesis Test II: t tests. Test for one population mean Test for the difference of two population means. Hypothesis Tests for Population Parameters. Population proportion Population mean Difference between two population means. 5 Steps in Hypothesis Tests.

E N D
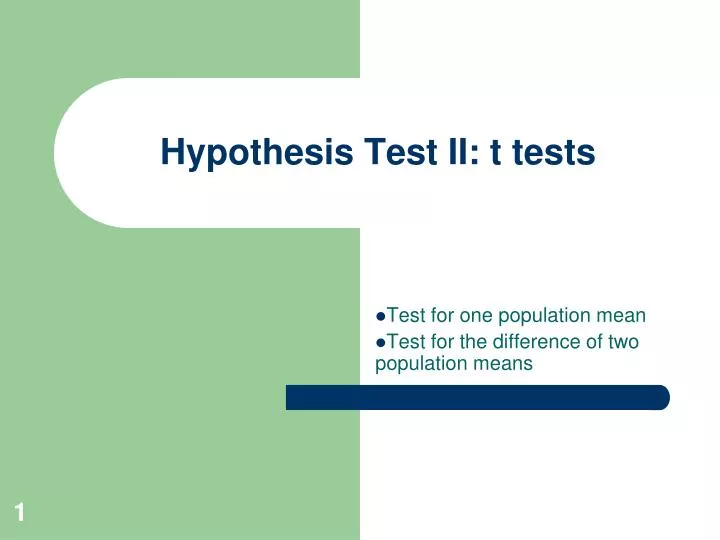
Hypothesis Test II: t tests Test for one population mean Test for the difference of two population means
Hypothesis Tests for Population Parameters • Population proportion • Population mean • Difference between two population means
5 Steps in Hypothesis Tests • Step 1. Determine the null (Ho) and alternative (Ha) hypotheses Ho : the population parameter = a constant (called the null value) Ha : upper or lower or two-tailed
5 Steps in Hypothesis Tests • Step 2. Find an appropriate test statistic and pre-set the level of significance (called a level) Test statistic = (Sample estimate – null value) (S.E. of sample estimate@ null value) a= 0.05 (or 0.01 or 0.10)
5 Steps in Hypothesis Tests • Step 3. Check the conditions and find the p-value assuming Ho is true The calculation of the p-value depends on the Ha.
5 Steps in Hypothesis Tests • Step 4. Decide whether or not reject Ho based on the p-value p-value > a fail to reject Ho p-value <a reject Ho (= accept Ha)
5 Steps in Hypothesis Tests • Step 5. Report the result in the context of the situation Reject Ho There is sufficient evidence to support (Ha). Fail to reject Ho There is not sufficient evidence to support (Ha).
Hypothesis Test for a Population Mean • Step 1. Ho: m = mo Three possible Ha’s: Ha: m = mo (two-tailed) or Ha: m < mo (lower-tailed) or Ha: m > mo (upper-tailed)
Hypothesis Test for a Population Mean • Step 2. test statistic
Hypothesis Test for a Population Mean • Step 3: • Condition: Must be a random sample and the data must be bell-shaped (or normal) • When the above conditions are met, use t-Table to find p-value (the required df = n-1) This test is called “one-sample t-test.”
Examples The average cost of 30 randomly selected used cars in a used car lot was $5,000 with sample standard deviation of $1,000. • Find the p-value for testing Ho: m = $4,500 vs. Ha: m = $4,500. Answer: t = 2.74 and 0.006 < p-value < 0.016
Examples • Find the p-value for testing Ho: m = $4,500 vs. Ha: m > $4,500. • Find the p-value for testing Ho: m = $4,500 vs. Ha: m < $4,500.
Hypothesis Test for the Difference of Two Population Means • Step 1. Ho: m1 = m2 Three possible Ha’s: Ha: m1 = m2 (two-tailed) or Ha: m1 < m2 (lower-tailed) or Ha: m1 > m2 (upper-tailed)
Hypothesis Test for the Difference between Two Population Means • Step 2. test statistic
Hypothesis Test for the Difference between Two Population Means • Step 3: • Must be two independent random samples; the both samples must be bell-shaped (or normal) • When the above conditions are met, use t-Table to find the p-value (the required df is the smaller one of (n1-1) and (n2-1)) This test is called “Two-sample t-test.”
Examples The average waiting time for 50 students to connect to the college server from the dormitories was 5 seconds, while the average time to connect for 20 students living off-campus apartments was 10 seconds. Assume the times to connect in the dormitories and the apartments are both bell-shaped. The sample standard deviations were 2 seconds for dormitories and 8 seconds for apartments
Examples • Find the p-value for testing Ho: m1 = m2 vs. Ha: m1 = m2 • Find the p-value for testing Ho: m1 = m2 vs. Ha: m1 < m2 Answer: t = -2.76 1: dormitories; 2: apartments