Download
1 / 17
170 likes | 172 Vues
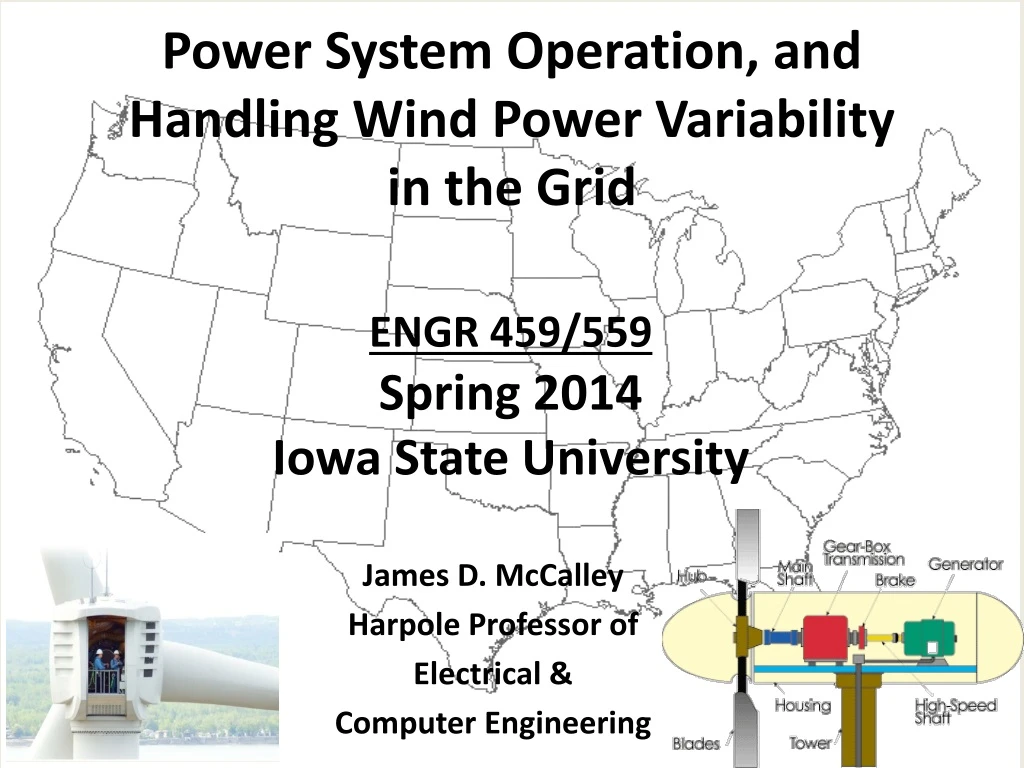
ENGR 459/559 Spring 2014 Iowa State University. Power System Operation, and Handling Wind Power Variability in the Grid. James D. McCalley Harpole Professor of Electrical & Computer Engineering. Outline. Basic problems, potential solutions Wind power equation

E N D
ENGR 459/559Spring 2014Iowa State University Power System Operation, and Handling Wind Power Variability in the Grid James D. McCalley Harpole Professor of Electrical & Computer Engineering
Outline Basic problems, potential solutions Wind power equation Illustration of power variability Power balance control levels 2
Basic problems with wind & power balance Wind is a variable resource when it is controlled to maximize its power production Definition: NETLOAD.MW=LOAD.MW+LOSSES.MW-WIND.MW Fact: Wind increases NETLOAD.MW variability in grid Fact: Grid requires GEN.MW=NETLOAD.MW always Fact: “Expensive” (based on marginal cost) gens move (ramp) quickly, “cheap” gens don’t, some gens do not ramp at all. Problem: Increasing wind increases need for more and “faster” resources to meet variability, increasing cost of wind. Wind is an uncertain resource Fact: Market makes day-ahead decisions for “unit commitment” (UC) based on NETLOAD.MW forecast. Fact: Large forecast error requires available units compensate. Problem: Too many (under-forecast) or too few (over-forecast) units may be available, increasing the cost of wind. 3
We have always dealt with variability and uncertainty in the load, so no changes are needed. • Increase MW control capability during periods of expected high variability via one or more of the following: • control of the wind (and solar) power; • more conventional generation (e.g., combustion turbines); • demand control; • storage. Perspectives on addressing variability & uncertainty 4
Power production: Wind power equation (a 1-dimensional treatment) Mass flow rate is the mass of substance which passes through a given surface per unit time. Swept area At of turbine blades: The disks have larger cross sectional area from left to right because • v1 > vt > v2 and • the mass flow rate must be the same everywhere within the streamtube (conservation of mass*): ρ=air density (kg/m3) Therefore, A 1 < At < A 2 v1 vt v2 v x * If the mass flow rate varies with x, then it necessarily means some mass has “piled up” at some point x. 5
Power production Cp vs. λ and θ • This analysis is based on simplifying assumptions: • Homogeneous and incompressible (implying constant density throughout the mass volume of air) steady-state fluid-flow of the air • No frictional drag • Infinite number of blades • Uniform thrust over the disc or rotor area • Non-rotating wake (no wake downstream of the disc) • Static pressure far upstream and far downstream of rotor is equal to the undisturbed ambient static pressure 6
Power production Wind power equation 2. Air mass flowing: 1. Wind velocity: 3. Mass flow rate at swept area: 4b. Force on turbine blades: 4a. Kinetic energy change: 5b. Power extracted: 5a. Power extracted: 6b. Substitute (3) into (5b): 6a. Substitute (3) into (5a): 7. Equate 8. Substitute (7) into (6b): 9. Factor out v13: 7
Power production Wind power equation 10. Define wind stream speed ratio, a: This ratio is fixed for a given turbine & control condition. 11. Substitute a into power expression of (9): 12. Differentiate and find a which maximizes function: a=-1 will minimize the function, so that is not the one we want. 13. Find the maximum power by substituting a=1/3 into (11): 8
Power production Wind power equation 14. Define Cp, the power (or performance) coefficient, which gives the ratio of the power extracted by the converter, P, to the power of the air stream, Pin. power extracted by the converter power of the air stream 15. The maximum value of Cp occurs when its numerator is maximum, i.e., when a=1/3: The (Lanchester)-Betz Limit! 9
Power production Wind power equation 16. The power you cannot get to (the other 40%) is associated with the fact that you cannot stop the wind stream, i.e., the power in the wind cannot be extracted completely by a wind turbine, as the air mass would be then stopped completely in the intercepting rotor area. 10
Power production: Cp vs. λ and θ u: tangential velocity of blade tip Tip-speed ratio: ω: rotational velocity of blade R: rotor radius v1: upstream wind speed Pitch: θ GE SLE 1.5 MW CP changes with a=v2/v1. In response to v1, we increase θ>0° only if v1 exceeds max wind speed; otherwise θ≈0°. Then ω is set by gen control to provide λ that maximizes Cp. 11
Power production Cp vs. λ and θ Why does production increase and then fall off as rotor speed increases? “If the blade angular speed ω is too small, most of the wind may pass undisturbed through the blade swept area making little useful work on the blades. On the contrary, if ω is too large, the fast rotating blades may block the wind flow reducing the power extraction. Therefore, there exists an optimal angular speed at which the maximum power extraction is achieved.” W. Tong, “”Fundamentals of wind energy,” in “Wind power generation and wind turbine design,” edited by W. Tong, WIT Press, 2010. An aerodynamic view would consider lift and drag – in particular, it is increasing drag which is responsible for the fall off beyond optimal angular speed. 12
Power production Cp vs. λ and θ u: tangential velocity of blade tip Tip-speed ratio: ω: rotational velocity of blade R: rotor radius Important concept #1: The control strategy of all US turbines today is to operate turbine at point of maximum energy extraction, as indicated by the locus of points on the black solid line in the figure. Important concept #2: • This strategy maximizes the energy produced by a given wind turbine. • Any other strategy “spills” wind !!! Important concept #3: For a given v1 and θ, MPPT chooses ω (and thus λ) via gen speed control to maximize Cp (or P). Then, you can plot the P against v1, leading to the well-known wind power curve as seen on the next slide… v1: wind speed GE SLE 1.5 MW 13
Power production Usable speed range The area of high variability is here. Cut-in speed (6.7 mph) Cut-out speed (55 mph) 14
Wind Power Temporal & Spatial Variability JULY2006 JANUARY2006 Blue~VERY LOW POWER; Red~VERY HIGH POWER Notice the temporal variability: • lots of cycling between blue and red; • January has a lot more high-wind power (red) than July; Notice the spatial variability • “waves” of wind power move through the entire Eastern Interconnection; • red occurs more in the Midwest than in the East 15
Power production Wind Power Equation • So power extracted depends on • Design factors: • Swept area, At • Environmental factors: • Air density, ρ (~1.225kg/m3 at sea level) • Wind speed v3 • 3. Control factors: • Pitch θ • CPas a function of λ 16
Power Balance Control Levels After a disturbance Steady-state We will study each of these control levels later in the course. 17