Download
1 / 54
540 likes | 543 Vues
2006-2007 VRA PROFESSIONAL STATUS SURVEY Preliminary Results Delivered at 2007 VRA Conference, Kansas City

E N D
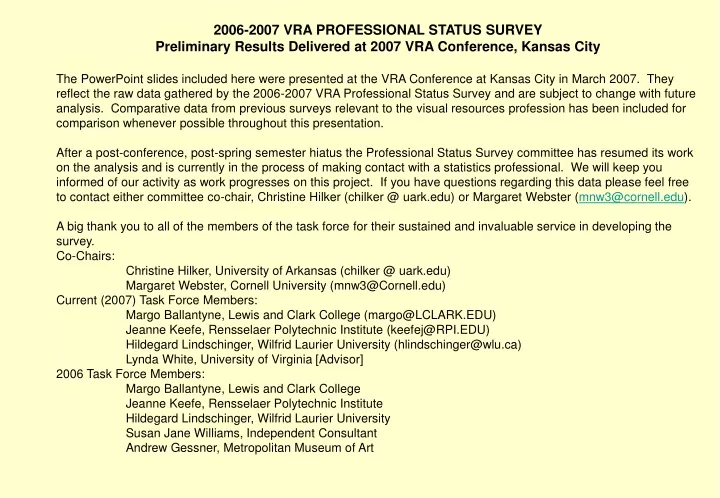
2006-2007 VRA PROFESSIONAL STATUS SURVEY Preliminary Results Delivered at 2007 VRA Conference, Kansas City The PowerPoint slides included here were presented at the VRA Conference at Kansas City in March 2007. They reflect the raw data gathered by the 2006-2007 VRA Professional Status Survey and are subject to change with future analysis. Comparative data from previous surveys relevant to the visual resources profession has been included for comparison whenever possible throughout this presentation. After a post-conference, post-spring semester hiatus the Professional Status Survey committee has resumed its work on the analysis and is currently in the process of making contact with a statistics professional. We will keep you informed of our activity as work progresses on this project. If you have questions regarding this data please feel free to contact either committee co-chair, Christine Hilker (chilker @ uark.edu) or Margaret Webster (mnw3@cornell.edu). A big thank you to all of the members of the task force for their sustained and invaluable service in developing the survey. Co-Chairs: Christine Hilker, University of Arkansas (chilker @ uark.edu) Margaret Webster, Cornell University (mnw3@Cornell.edu) Current (2007) Task Force Members: Margo Ballantyne, Lewis and Clark College (margo@LCLARK.EDU) Jeanne Keefe, Rensselaer Polytechnic Institute (keefej@RPI.EDU) Hildegard Lindschinger, Wilfrid Laurier University (hlindschinger@wlu.ca) Lynda White, University of Virginia [Advisor] 2006 Task Force Members: Margo Ballantyne, Lewis and Clark College Jeanne Keefe, Rensselaer Polytechnic Institute Hildegard Lindschinger, Wilfrid Laurier University Susan Jane Williams, Independent Consultant Andrew Gessner, Metropolitan Museum of Art
2006-2007 Visual Resources Professional Status SurveyPreliminary Report Christine Hilker, University of Arkansas & Margaret N. Webster, Cornell University Kansas City, 03/27/2007
Do you write an annual report? 2007 2000
Has your position changed in the last 5 years without a change in rank, grade, pay scale, etc? 2007 2000
Professional Organizations VRA -2007
Served as Officer of a Professional Organization VRA 2007 & 2000
Slide Acquisitions Stopped – When? Not applicable 2007 2004 2002 2000 1998
Average Total Number ofItemsCirculated Per Year for the Last 5 Years (VRA Survey of 2000) 32,555
Primary Responsibility for Locally Developed Digital Image Collection – VRA 2007
Digital ImagesAverage Acquisitions per Annum (VRA Survey of 2000) 351
Size of Digital Collection- 2007 Developed locally within your institution, not online subscriptions. (Count “master” images only, not derivatives.):
Average Digital Collection Size (VRA Survey of 2000) 2,004
Unit’s Responsibility for Acquiring Licensed or Subscription Digital Images – VRA 2007
Other Unit(s) That Acquire Licensed Digital Images and/or Subscribe to Digital Image Collections.
Has the Presence of Licensed or Subscription Digital Collections Had an Impact on Your Job?