Download
1 / 11
110 likes | 115 Vues
Learn how to determine if a set of ordered pairs represents a linear, quadratic, or exponential function using graphs and differences or ratios.

E N D
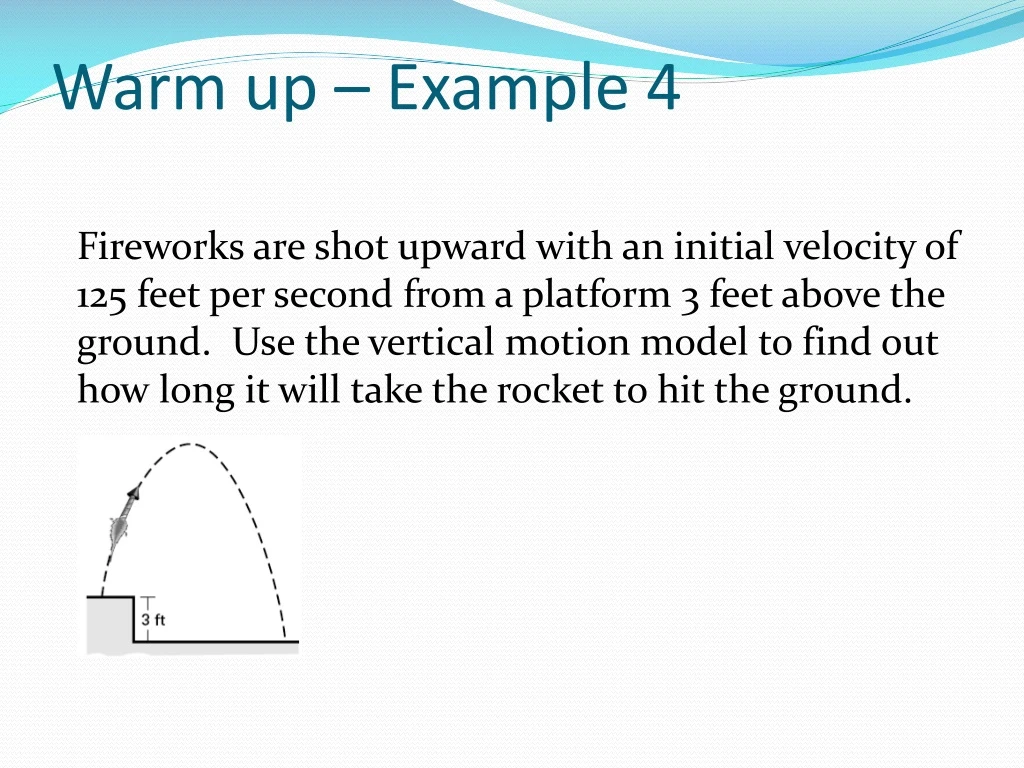
Warm up – Example 4 Fireworks are shot upward with an initial velocity of 125 feet per second from a platform 3 feet above the ground. Use the vertical motion model to find out how long it will take the rocket to hit the ground.
9.6 Notes Analyzing Functions with Successive Differences
In previous sections we learned to graph linear, exponential and quadratic functions. Now we want to be able to identify linear, quadratic, and exponential functions from given data.
Example 1: Choose a Model Using Graphs Graph the ordered pairs. Determine whether the ordered pairs represent a linear, quadratic, or exponential function. A. (1, 2), (2, 5), (3, 6), (4, 5), (5, 2)
Example 1: Choose a Model Using Graphs Graph the ordered pairs. Determine whether the ordered pairs represent a linear, quadratic, or exponential function. B. C. (–2, –6), (0, –3), D. (–2, 0), (–1, –3), (0, –4), (2, 0), (4, 3) (1, –3), (2, 0)
Choose a Model Using Differences or Ratios 1. Subtract each consecutive y-values. Look for the differences to be the SAME number. This is the first difference. If they are equal, it is a LINEAR function. 2. If not equal subtract each difference again. Look for the same number, this is the second difference. If equal, it is a QUADRATIC function. 3. If the differences are still not equal look for a ratio of the y-values. If this is equal it is an EXPONENTIAL function.
Example 2: Look for a pattern in the table of values to determine which kind of model best describes the data. A.
Example 2: Look for a pattern in the table of values to determine which kind of model best describes the data. B.
Example 2: Look for a pattern in the table of values to determine which kind of model best describes the data. C.
Exit Slip • Look for a pattern in the set of ordered pairs to determine which kind of model best describes the data.