Download
1 / 1
10 likes | 121 Vues
Determination of Operating Characteristics and Performance Requirements for a Methotrexate Forecasting Algorithm Used for Clinical Decision Support in Pediatric Oncology Patients Erin Cummings, Bhuvana Jayaraman, John Mondick, and Jeffrey S. Barrett

E N D
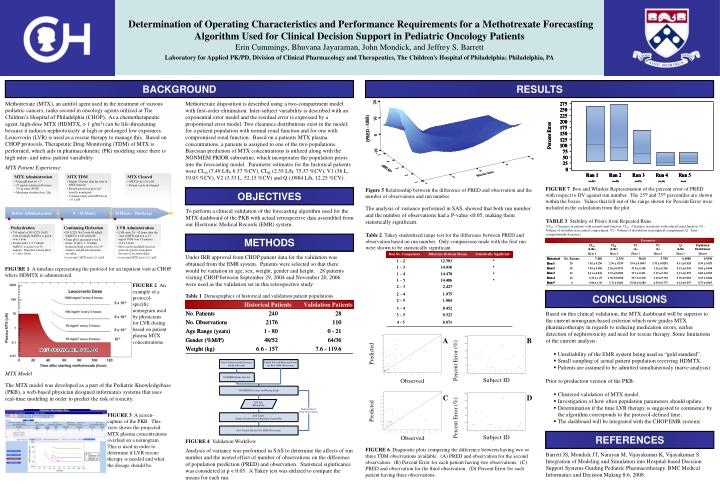
Determination of Operating Characteristics and Performance Requirements for a Methotrexate Forecasting Algorithm Used for Clinical Decision Support in Pediatric Oncology Patients Erin Cummings, Bhuvana Jayaraman, John Mondick, and Jeffrey S. Barrett Laboratory for Applied PK/PD, Division of Clinical Pharmacology and Therapeutics, The Children's Hospital of Philadelphia; Philadelphia, PA A B MTX Model The MTX model was developed as a part of the Pediatric Knowledgebase (PKB), a web-based physician designed informatics systems that uses real-time modeling in order to predict the risk of toxicity. C D FIGURE 3 A screen-capture of the PKB. This view shows the projected MTX plasma concentrations overlaid on a nomogram. This is used in order to determine if LVR rescue therapy is needed and what the dosage should be. FIGURE 6 Diagnostic plots comparing the difference between having two or three TDM observations available. (A) PRED and observation for the second observation. (B) Percent Error for each patient having two observations. (C) PRED and observation for the third observation. (D) Percent Error for each patient having three observations. BACKGROUND RESULTS Methotrexate (MTX), an antifol agent used in the treatment of various pediatric cancers, ranks second in oncology agents utilized at The Children’s Hospital of Philadelphia (CHOP). As a chemotherapeutic agent, high-dose MTX (HDMTX, > 1 g/m2) can be life-threatening because it induces nephrotoxicity at high or prolonged low exposures. Leucovorin (LVR) is used as a rescue therapy to manage this. Based on CHOP protocols, Therapeutic Drug Monitoring (TDM) of MTX is performed, which aids in pharmacokinetic (PK) modeling since there is high inter- and intra- patient variability. MTX Patient Experience Methotrexate disposition is described using a two-compartment model with first-order elimination. Inter-subject variability is described with an exponential error model and the residual error is expressed by a proportional error model. Two clearance distributions exist in the model; for a patient population with normal renal function and for one with compromised renal function. Based on a patients MTX plasma concentrations, a patients is assigned to one of the two populations. Bayesian prediction of MTX concentrations is utilized along with the NONMEM PRIOR subroutine, which incorporates the population priors into the forecasting model. Parameter estimates for the historical patients were CLN (7.49 L/h, 6.37 %CV), CLR (2.55 L/h, 75.37 %CV), V1 (36 L, 19.03 %CV), V2 (3.33 L, 52.15 %CV) and Q (.0984 L/h, 12.25 %CV). FIGURE 7 Box and Whisker Representation of the percent error of PRED with respect to DV against run number. The 25th and 75th percentiles are shown within the boxes. Values that fell out of the range shown for Percent Error were included in the calculation from the plot. Figure 5 Relationship between the difference of PRED and observation and the number of observations and run number. OBJECTIVES The analysis of variance performed in SAS, showed that both run number and the number of observations had a P-value <0.05, making them statistically significant. To perform a clinical validation of the forecasting algorithm used for the MTX dashboard of the PKB with actual retrospective data assembled from our Electronic Medical Records (EMR) system. TABLE 3 Stability of Priors from Repeated Runs. (CLN – Clearance in patients with normal renal function. CLR - Clearance in patients with reduced renal function, V1 – Volume of distribution in central compartment, V2 - Volume of distribution in peripheral compartment, Q – Inter-compartmental clearance) Table 2 Tukey studentized range test for the difference between PRED and observation based on run number. Only comparisons made with the first run were shown to be statistically significant. METHODS Under IRB approval from CHOP patient data for the validation was obtained from the EMR system. Patients were selected so that there would be variation in age, sex, weight, gender and height. 28 patients visiting CHOP between September 29, 2004 and November 20, 2006 were used as the validation set in this retrospective study. FIGURE 1 A timeline representing the protocol for an inpatient visit at CHOP where HDMTX is administered. FIGURE 2 An example of a protocol-specific nomogram used by physicians for LVR dosing based on patient plasma MTX concentrations. Table 1 Demographics of historical and validation patient populations. CONCLUSIONS • Based on this clinical validation, the MTX dashboard will be superior to the current nomogram-based criterion which now guides MTX pharmacotherapy in regards to reducing medication errors, earlier detection of nephrotoxicity and need for rescue therapy. Some limitations of the current analysis: • Unreliability of the EMR system being used as “gold standard”. • Small sampling of actual patient population receiving HDMTX. • Patients are assumed to be admitted simultaneously (naïve analysis). • Prior to production version of the PKB: • Clustered validation of MTX model. • Investigation of how often population parameters should update. • Determination if the time LVR therapy is suggested to commence by the algorithm corresponds to the protocol-defined time. • The dashboard will be integrated with the CHOP EMR systems. REFERENCES FIGURE 4 Validation Workflow Analysis of variance was performed in SAS to determine the affects of run number and the nested effect of number of observations on the difference of population prediction (PRED) and observation. Statistical significance was considered at p < 0.05. A Tukey test was utilized to compare the means for each run. Barrett JS, Mondick JT, Narayan M, Vijayakumar K, Vijayakumar S. Integration of Modeling and Simulation into Hospital-based Decision Support Systems Guiding Pediatric Pharmacotherapy. BMC Medical Informatics and Decision Making 8:6, 2008.