Download
1 / 10
130 likes | 365 Vues
Global Greenhouse Gas Emissions by Gas. http:// epa.gov/climatechange/ghgemissions/global.html Source: IPCC (2007) ; based on global emissions from 2004. . Fuel Mix for U.S. Electricity Generation. http://www.epa.gov/cleanenergy/energy-and-you/index.html. Greenhouse Gas emissions by country.

E N D
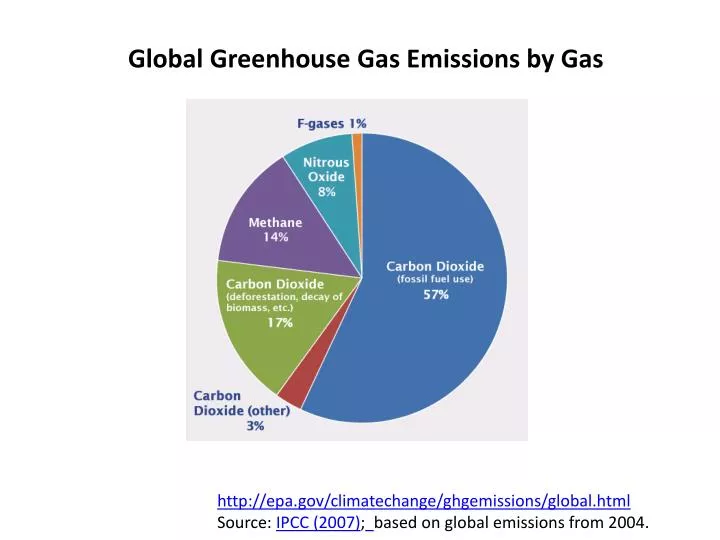
Global Greenhouse Gas Emissions by Gas http://epa.gov/climatechange/ghgemissions/global.html Source: IPCC (2007);based on global emissions from 2004.
Fuel Mix for U.S. Electricity Generation http://www.epa.gov/cleanenergy/energy-and-you/index.html
Energy • Energy Intensity Ei • Indicates how much a national economy is dependent on energy per unit of economic output or gross domestic product (GPD) • The smaller Ei the better. Energy for Sustainability (2008)
Eastern Europe,/Former Soviet Union China, India, etc US, EU
IIASA - International Institute for Applied System Analysis: Energy Use Predictions for scenario A1 (BAU)
What CO2 concentration should we strive for? • 350 ppm ? • 450 ppm ? • 550 ppm ? • 650 ppm ? • 750 ppm ? The lower the number, the harder for the economy to recover
Simulated changes in atmospheric greenhouse concentration CH4 CO2 N2O FAQ 10.3, Figure 1. (a) Simulated changes in atmospheric CO2 concentration relative to the present-day for emissions stabilised at the current level (black), or at 10% (red), 30% (green), 50% (dark blue) and 100% (light blue) lower than the current level; (b) as in (a) for a trace gas with a lifetime of 120 years, driven by natural and anthropogenic fluxes; and (c) as in (a) for a trace gas with a lifetime of 12 years, driven by only anthropogenic fluxes.
How much will it cost to change? • Which is worth more to you, according to economic theory: $200 given to you today, or $200 given to you one year from now? • At 5% interest (discount rate) , $200 in the bank today will grow to $210 in one year. $200 ×(1.05) $200 times 1.05 = $210 Present Value ×( 1 + Interest Rate ) Present Value times (1 + Interest Rate) = Future Value in One Year Multiplying $200 by 1.05 is mathematically equivalent to adding 5% to it. It costs less to fix global warming now than it will in the future but we needn’t stop all economic growth to fix the problem Social Discount Rate is a measure used to help guide choices about the value of diverting funds to social projects. It is defined as “the appropriate value of r to use in computing present discount value for social investments” ( the lower, the more future generations are valued
Bottom Line of economists • Dumping GHG’s into the atmosphere costs (externality) • The dumpers need to pay (internalize externality)