Download
1 / 1
10 likes | 175 Vues
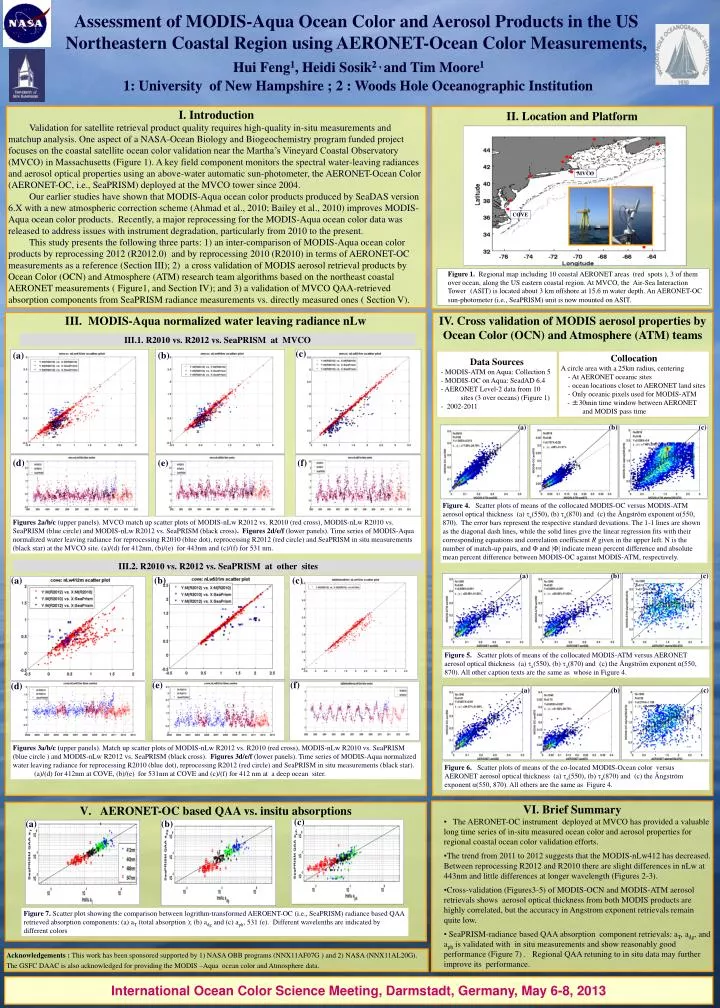
Assessment of MODIS-Aqua Ocean Color and Aerosol Products in the US Northeastern Coastal Region using AERONET-Ocean Color Measurements, Hui Feng 1 , Heidi Sosik 2 , and Tim Moore 1 1: University of New Hampshire ; 2 : Woods Hole Oceanographic Institutio n. I. Introduction

E N D
Assessment of MODIS-Aqua Ocean Color and Aerosol Products in the US Northeastern Coastal Region using AERONET-Ocean Color Measurements, Hui Feng1, Heidi Sosik2 , and Tim Moore1 1: University of New Hampshire; 2 :Woods Hole Oceanographic Institution I. Introduction Validation for satellite retrieval product quality requires high-quality in-situ measurements and matchup analysis. One aspect of a NASA-Ocean Biology and Biogeochemistry program funded project focuses on the coastal satellite ocean color validation near the Martha’s Vineyard Coastal Observatory (MVCO) in Massachusetts (Figure 1). A key field component monitors the spectral water-leaving radiances and aerosol optical properties using an above-water automatic sun-photometer, the AERONET-Ocean Color (AERONET-OC, i.e., SeaPRISM) deployed at the MVCO tower since 2004. Our earlier studies have shown that MODIS-Aqua ocean color products produced by SeaDAS version 6.X with a new atmospheric correction scheme (Ahmad et al., 2010; Bailey et al., 2010) improves MODIS-Aqua ocean color products. Recently, a major reprocessing for the MODIS-Aqua ocean color data was released to address issues with instrument degradation, particularly from 2010 to the present. This study presents the following three parts: 1) an inter-comparison of MODIS-Aqua ocean color products by reprocessing 2012 (R2012.0) and by reprocessing 2010 (R2010) in terms of AERONET-OC measurements as a reference (Section III); 2) a cross validation of MODIS aerosol retrieval products by Ocean Color (OCN) and Atmosphere (ATM) research team algorithms based on the northeast coastal AERONET measurements ( Figure1, and Section IV); and 3) a validation of MVCO QAA-retrieved absorption components from SeaPRISM radiance measurements vs. directly measured ones ( Section V). II. Location and Platform MVCO COVE • Figure 1. Regional map including 10 coastal AERONET areas (red spots ), 3 of them over ocean, along the US eastern coastal region. At MVCO, the Air-Sea Interaction Tower(ASIT) is located about 3 km offshore at 15.6 m water depth. An AERONET-OC sun-photometer (i.e., SeaPRISM) unit is now mounted on ASIT. IV. Cross validation of MODIS aerosol properties by Ocean Color (OCN) and Atmosphere (ATM) teams • MODIS-Aqua normalized water leaving radiance nLw III.1. R2010 vs. R2012 vs. SeaPRISM at MVCO (c) (a) (b) • Data Sources • - MODIS-ATM on Aqua: Collection 5 • - MODIS-OC on Aqua: SeadAD 6.4 • - AERONET Level-2 data from 10 sites (3 over oceans) (Figure 1) • - 2002-2011 Collocation A circle area with a 25km radius, centering - At AERONET oceanic sites - ocean locations closet to AERONET land sites - Only oceanic pixels used for MODIS-ATM - ±30min time window between AERONET and MODIS pass time (a) (b) (c) (d) (e) (f) Figure 4. Scatter plots of means of the collocated MODIS-OC versus MODIS-ATM aerosol optical thickness (a) a(550), (b) a(870) and (c) the Ångström exponent α(550, 870). The error bars represent the respective standard deviations. The 1-1 lines are shown as the diagonal dash lines, while the solid lines give the linear regression fits with their corresponding equations and correlation coefficient R given in the upper left. N is the number of match-up pairs, and Φ and |Φ| indicate mean percent difference and absolute mean percent difference between MODIS-OC against MODIS-ATM, respectively. Figures 2a/b/c (upper panels). MVCO match up scatter plots of MODIS-nLw R2012 vs. R2010 (red cross), MODIS-nLw R2010 vs. SeaPRISM (blue circle) and MODIS-nLw R2012 vs. SeaPRISM (black cross). Figures 2d/e/f (lower panels). Time series of MODIS-Aqua normalized water leaving radiance for reprocessing R2010 (blue dot), reprocessing R2012 (red circle) and SeaPRISM in situ measurements (black star) at the MVCO site. (a)/(d) for 412nm, (b)/(e) for 443nm and (c)/(f) for 531 nm. III.2. R2010 vs. R2012 vs. SeaPRISM at other sites (a) (b) (c) (a) (b) (c) Figure 5. Scatter plots of means of the collocated MODIS-ATM versus AERONET aerosol optical thickness (a) a(550), (b) a(870) and (c) the Ångström exponent α(550, 870). All other caption texts are the same as whose in Figure 4. (e) (f) (d) (a) (b) (c) Figures 3a/b/c (upper panels). Match up scatter plots of MODIS-nLw R2012 vs. R2010 (red cross), MODIS-nLw R2010 vs. SeaPRISM (blue circle ) and MODIS-nLw R2012 vs. SeaPRISM (black cross). Figures 3d/e/f (lower panels). Time series of MODIS-Aqua normalized water leaving radiance for reprocessing R2010 (blue dot), reprocessing R2012 (red circle) and SeaPRISM in situ measurements (black star). (a)/(d) for 412nm at COVE, (b)/(e) for 531nm at COVE and (c)/(f) for 412 nm at a deep ocean siter. Figure 6. Scatter plots of means of the co-located MODIS-Ocean color versus AERONET aerosol optical thickness (a) a(550), (b) a(870) and (c) the Ångström exponent α(550, 870). All others are the same as Figure 4. • VI. Brief Summary • The AERONET-OC instrument deployed at MVCO has provided a valuable long time series of in-situ measured ocean color and aerosol properties for regional coastal ocean color validation efforts. • The trend from 2011 to 2012 suggests that the MODIS-nLw412 has decreased. Between reprocessing R2012 and R2010 there are slight differences in nLw at 443nm and little differences at longer wavelength (Figures 2-3). • Cross-validation (Figures3-5) of MODIS-OCN and MODIS-ATM aerosol retrievals shows aerosol optical thickness from both MODIS products are highly correlated, but the accuracy in Angstrom exponent retrievals remain quite low. • SeaPRISM-radiance based QAA absorption component retrievals: aT, adg, and aph is validated with in situ measurements and show reasonably good performance (Figure 7) . Regional QAA retuning to in situ data may further improve its performance. • AERONET-OC based QAA vs. insitu absorptions (c) (a) (b) Figure 7. Scatter plot showing the comparison between logrithm‐transformed AEROENT-OC (i.e., SeaPRISM) radiance based QAA retrieved absorption components: (a) aT (total absorption ); (b) adg and (c) aph, 531 (e). Different wavelenths are indicated by different colors Acknowledgements : This work has been sponsored supported by 1) NASA OBB programs (NNX11AF07G ) and 2) NASA (NNX11AL20G). The GSFC DAAC is also acknowledged for providing the MODIS –Aqua ocean color and Atmosphere data. International Ocean Color Science Meeting, Darmstadt, Germany, May 6-8, 2013