Download

1 / 27
270 likes | 421 Vues
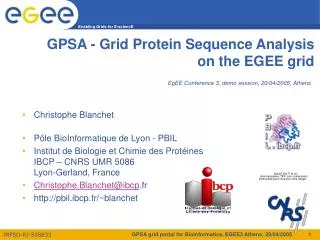
Crystallization Image Analysis on the World Community Grid. Christian A. Cumbaa and Igor Jurisica Jurisica Lab, Division of Signaling Biology Ontario Cancer Institute, Toronto, Ontario. phase separation. clear. precipitate. skin. garbage. unsure. crystal. X.

E N D
Crystallization Image Analysis on the World Community Grid Christian A. Cumbaa and Igor Jurisica Jurisica Lab, Division of Signaling Biology Ontario Cancer Institute, Toronto, Ontario
phase separation clear precipitate skin garbage unsure crystal X Why automate classification of protein crystallization trial images? • Hauptman-Woodward has 65,000,000 images. • They want 65,000,000 outcomes.
Why automate classification of protein crystallization trial images? • Assist or replace human screening • Speed the search phase in protein crystallization • Improve throughput, consistency, objectivity • Enables data mining and statistical optimization of the crystallization process clear precipitate crystal
feature extraction classification phase separation garbage unsure precipitate clear skin feature 1 feature 2 … feature k crystal X 100000s of numbers 10s of numbers 7 numbers Image classification
96 study 96 proteins X 1536 images hand-scored by 3 experts Presence/absence of 7 independent outcomes NESG & SGPP 15000 images Hand-scored by 1 expert, same scoring system 50% unanimously-scored images 10 most interesting compound categories Truth data 96-study NESG (crystals) SGPP (crystals)
12375 features computed per image A few basic statistics 50 microcrystal features Euler number features, two variations 11 Blur levels 11 Blur levels X 4 thresholds Image “energy” 11 blur levels 2925 Grey-Level Co-occurrence Matrix features 3 different grey-level quantizations 13 basic functions 25 sample distances ~100 directions Computable from every point in the image Distilled to max range, max mean, min mean ~9500 image-blob features Radon & edge-detection Feature set
Our image analysis problem • Computing all 12,375 features takes >5 hours for a single image • We have 165,000 images in our training set • Features must be evaluated for quality • The best features (10s or low 100s) must be computed for the remaining 65,000,000 images Massive computing resources required!
Image analysis on the World Community Grid • http://www.worldcommunitygrid.org • a global, distributed-computing platform for solving large scientific computing problems with human impact • 377,627 volunteers contribute idle CPU time of 960,346 devices. • Our project: Help Conquer Cancer* • launched November 2007. • HCC has two goals: • To survey a wide tract of image-feature space and identify image analysis algorithms and parameters (features) that best determine crystallization outcome. • To perform the necessary image analysis on Hauptman Woodward’s archive of 65,000,000 crystallization trial images. * fundraising slogan of the Ontario Cancer Institute and its parent organization.
Image analysis on the World Community Grid • HCC has two phases • Phase I: calculate 12,375 features per image on high-priority images, including 165,441 hand-scored images. • November 2007-May 2008 • analysis on hand-scored images completed January 2008 • Phase II: calculate the best features from Phase I on the backlog of HWI images • Grid members have contributed 8,919 CPU-years so far to HCC, an average of 55 CPU-years per day.
Measuring feature quality feature entropy • Treat as random variables: • Image class • Feature value • Measure the mutual information between them (unit: bits) = entropy(class) + entropy(feature) – entropy(class,feature) class entropy
clear precipitate (no crystal) other Measuring feature quality
Clear Precipitate Crystal Information density: microcrystal counts parameter space
Information density: GLCM maximum range parameter space Clear Precipitate Crystal
Information density: Radon-Sobel soft sum parameter space Clear Precipitate Crystal
Information density: Radon-Sobel blob metrics (means) parameter space Clear Precipitate Crystal
Building classifiers • handpicked 74 features from peaks in the clear, precipitate and other mutual information plots • two classification schemes three-way: clear, non-crystal precipitate, other ten-way: clear, phase separation, phase + precipitate, skin, phase + crystal, precip, precip + skin, precip + crystal, crystal, garbage • naïve Bayes model • leave-one-out cross-validation
false negatives true positives false positives Measuring classifier accuracy: precision and recall crystals recall “I think these are crystals” precision
clear non-crystal precipitate other machine says true class clear non-crystal precipitate other 27615 817 617 1819 45112 15928 5109 5258 17095 Three-class distribution Confusion matrix
Confusion matrix clear phase separation phase and precipitate skin phase and crystal precipitate precipitate and skin precipitate and crystal crystal garbage machine says true class clear phase separation phase and precipitate skin phase and crystal precipitate precipitate and skin precipitate and crystal crystal garbage 25585 227 1 1135 0 815 1 0 92 1193 1446 2433 40 281 668 298 75 139 503 91 1 24 32 6 51 97 81 107 31 3 126 29 0 372 6 13 5 0 105 20 74 268 37 85 511 75 88 292 551 10 441 1972 494 617 553 16907 3440 4088 512 385 12 205 33 243 328 692 2008 395 305 29 35 222 85 111 562 1063 611 2852 914 8 888 345 56 586 649 219 90 1072 3129 129 28 4 0 49 1 52 2 0 20 313
Hauptman-Woodward Medical Research Institute George DeTitta, Joe Luft, Eddie Snell, Mike Malkowski, Angela Lauricella, Max Thayer, Raymond Nagel, Steve Potter, and the 96-study reviewers. World Community Grid Bill Bovermann, Viktors Berstis, Jonathan D. Armstrong, Tedi Hahn, Kevin Reed, Keith J. Uplinger, Nels Wadycki IBM Deep Computing: Jerry Heyman Jurisica Lab: Richard Lu All crystallization images were generated at the High-Throughput Screening lab at The Hauptman-Woodward Institute. Funding from NIH U54 GM074899 Genome Canada IBM NSERC (and earlier work from) NIH P50 GM62413 NSERC CITO Acknowledgements