Download
1 / 27
270 likes | 368 Vues
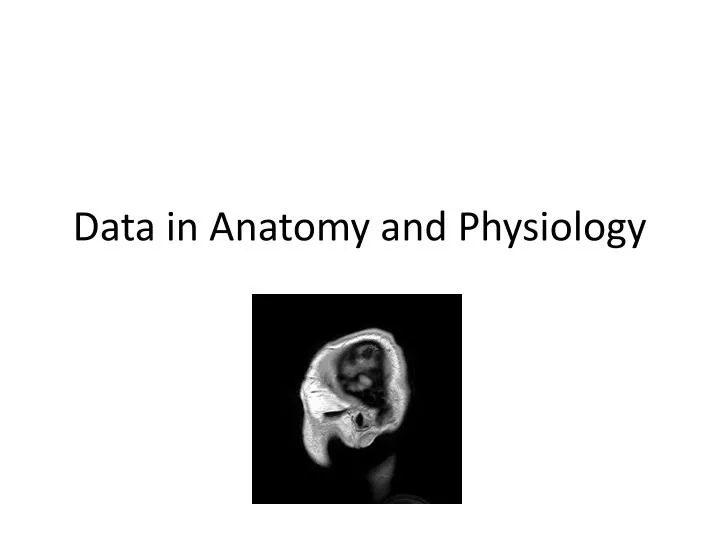
Data in Anatomy and Physiology. Anatomy = the structure of living things Physiology = the mechanical, physical, and biochemical functions of living things Data = information (values) belonging to a set of subjects. Characterize the anatomy of this animal.

E N D
Anatomy = the structure of living things • Physiology = the mechanical, physical, and biochemical functions of living things • Data = information (values) belonging to a set of subjects
Types of Data • Measurement – measurements with a value within a finite or infinite interval • Continuous – infinite number of values between • Discontinuous (meristic) – fixed numeric values • Ordinal – values that are ranked or have a rating scale • Nominal(Categorical) – cannot be measured; qualitative
Descriptive Statistics Three categories Measures of central tendency Measures of variability Measures of an overall distribution’s characteristics
Central Tendency • Mean (average) • Median (middle value) • Mode (most common) Variability • Minimum/Maximum • Variance • Standard deviation • Standard error Jaw opening time (ms) of Hawaiian eleotrid piscivorous predator, Eleotrissandwicensis Distribution Characteristics • Skewness (where longest “tail” is) • Kurtosis (shape of distribution) • + leptokurtosis • - platykurtosis
Presenting Data – Tables • Advantages? • Disadvantages?
Presenting Data - Figures • Advantages? • Disadvantages? Independent variable? Dependent variable? Y-axis First, some exceptions… X-axis
Pie Chart Percent contribution of various foods to average American’s salt intake.
Histogram Frequency distribution of speeds for two groups.
Bar Graph Average bite force for males and females.
Box Plot What are the parts of these? Box plot of serum Na+ and serum K + in HS and SD. Box plot of kidney weight in HS and SD.
Line Graph Percent of maximal activity for + taurocholate and – taurocholate as a function of pH levels. Lactate concentrations after amylin injection.
Scatterplot Correlation: no cause and effect; variables can be interchanged on axes Mortality per year as a function of cigarette consumption.
Scatterplot Regression: cause and effect; variables CANNOT be interchanged on axes Allometry = how characteristics of living creatures change with size Wing area as a function of body mass.
Collared Lizards Males Head width Juveniles Hindlimb length Females Hypothesize what explains these differences in allometry Snout-vent length
Statistics • Why? • To separate real effects from random variation • Assumptions • Observations are independent • Your sample measurements came from a large group (population) • The population has a normal distribution (parametric statistics); if not use different tests (non-parametric) • P-values • The probability that a test statistic at least as extreme would occur by chance alone • If P < 0.05, the test result is typically considered statistically significant
Student t-test • To compare the difference between two sample means • One- vs. two-tailed • Assumes you do or don’t know the direction of the differences • Conditions • Groups are independent: if not, paired t-test • Normal distribution • Large sample size • Non-parametric: Mann-Whitney U test
Correlation and Regression • Relationship between continuous variables • Correlation: to measure the strength of a relationship between variables • Regression: • to analyze a cause-effect relationship • to develop a model to predict untested variables • Correlation coefficient: -1 < r < 1 • Goodness of fit: 0 < R2 < 1 • Don’t assume that a linear model is always the best one
Correlation No cause and effect; variables can be interchanged on axes
Analysis of Variance (ANOVA) • To examine the effect of levels of a particular treatment • To compare more than two sample groups • Post-hoc tests, e.g., Tukey-Kramer HSD, LSD • It is NOT appropriate to run multiple t-tests on multiple groups of data • Non-parametric: Kruskal-Wallis test
Let’s Measure! • Measure and plot some trait as a function of body size for all cats in the lab (each cat is a data point) • Measure and plot same trait as a function of body size for all mammal species available in lab (each SPECIES is a data point) Each point = species average Individual cats Trait X Trait X Body size Body size