Download
1 / 10
100 likes | 222 Vues
CO 2 Emission of Water Bottles. The Economics of Sustainability and the Environment Fall 2013. Wonjoon ( Michael) Choi. Why particular topic?. Learned from the course, ‘Introduction to Sustainability’, in the last spring semester

E N D
CO2 Emission of Water Bottles The Economics of Sustainability and the Environment Fall 2013 Wonjoon (Michael) Choi
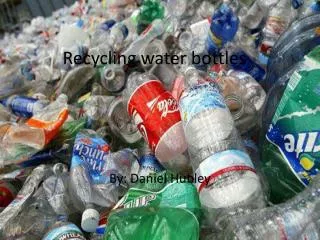
Why particular topic? • Learned from the course, ‘Introduction to Sustainability’, in the last spring semester • We the US consume about 1,500 water bottles every second; at least, 50 million water bottles are thrown each day.
My Intention • 1. Comparing the data on how much water bottles are used in different parts of the world • 2. Hypothetically, relate those data with the data on GDP per Capital or Population Growth Rate or Energy (oil production) (any correlation?) • 3. Some other approaches in regard to figuring out how much CO2 emission water bottles generate • 4. Few ways to reduce overdose CO2 emission of water bottles
#1. Comparing the data on how much water bottles are used in different parts of the world • North America (e.g. United States) – 8,454.0 millions of gallons. (rank 1) • (e.g. Mexico) – 6,887.1 millions of gallons. (rank 2) • South America (e.g. Brazil) – 4,252.5 millions of gallons. (rank 4) • Europe (e.g. Italy) - 2,947.2 millions of gallons. (rank 5) • (e.g. Spain) - 1,272.4 millions of gallons. (rank 10) • Middle East (e.g. Saudi Arabia) – 28 gallons per capita: 28 * 27M ~ 756 millions of gallons. • North Africa (e.g. Egypt) – 3.8 liters per capita (1 gallon per capita): 1 * 80M ~ 80 millions of gallons. • Sub-Saharan Africa (60% have access to somewhat qualifying water) • East Asia (e.g. China) - 5,688.6 millions of gallons. (rank 3) • South East Asia (e.g. Indonesia) - 2,938.6 millions of gallons. (rank 6) • * 0.15 pounds of CO2 emission per 12 ounces (0.094 gallons) of water bottle (1.596pounds per gallon)
#2. Hypothetically, relate those data with the data on GDP per Capita or Population Growth Rate or Energy (oil production)(any correlation?) GDP per Capita (Based on year 2009) • North America (e.g. United States) – 8,454.0 millions of gallons. (rank 1) GDP per Capita: 40,577. • (e.g. Mexico) – 6,887.1 millions of gallons. (rank 2) GDP per Capita: 10,980. • South America (e.g. Brazil) – 4,252.5 millions of gallons. (rank 4) GDP per Capita: 9,565. • Europe (e.g. Italy) - 2,947.2 millions of gallons. (rank 5) GDP per Capita: 26,228. • (e.g. Spain) - 1,272.4 millions of gallons. (rank 10) GDP per Capita: 26,950. • Middle East (e.g. Saudi Arabia) – 28 gallons per capita: 28 * 27M ~ 756 millions of gallons. GDP per Capita: 22,943. • North Africa (e.g. Egypt) – 3.8 liters per capita (1 gallon per capita): 1 * 80M ~ 80 millions of gallons. GDP per Capita: 5,898. • Sub-Saharan Africa (60% have access to somewhat qualifying water) GDP per Capita (e.g. Nigeria): 2,186. • East Asia (e.g. China) - 5,688.6 millions of gallons. (rank 3) GDP per Capita: 7,409. • South East Asia (e.g. Indonesia) - 2,938.6 millions of gallons. (rank 6) GDP per Capita: 3,803. • * No correlation of CO2 emission of water bottles with GDP per Capita.
Population Growth Rate (Based on year 2009) • North America (e.g. United States) – 0.88%. • (e.g. Mexico) – 1.30%. • South America (e.g. Brazil) – 0.89%. • Europe (e.g. Italy) – 0.60%. • (e.g. Spain) – 0.77%. • Middle East (e.g. Saudi Arabia) – 2.40%. • North Africa (e.g. Egypt) – 1.80%. • Sub-Saharan Africa (e.g. Nigeria) – 2.50%. • East Asia (e.g. China) – 0.51%. • South East Asia (e.g. Indonesia) – 1.00%. • * As more GDP per capita does not mean more population growth rate, no correlation with population growth rate.
Oil Production (Tones Based on year 2009) • North America (e.g. United States) – 328,622,275. • (e.g. Mexico) – 147,440,072. • South America (e.g. Brazil) – 106,040,480. • Europe (e.g. Italy) – 4,572,270. • Middle East (e.g. Saudi Arabia) – 462,737,293. • North Africa (e.g. Egypt) – 35,260,000. • Sub-Saharan Africa (e.g. Nigeria) – 101,535,900. • East Asia (e.g. China) – 189,490,000. • South East Asia (e.g. Indonesia) – 47,941,705. • * Total crude oil production shows no clear correlation with CO2 emission of water bottles.
#3. Other approaches in regard to the correlation with CO2 emission water bottles generate Analysis (Calculating Cost of Capital) • CO2 cost of equity = CO2 risk-free Rate (3%) + Beta (1) * CO2 Risk Premium (3%) = 6%. • After-tax CO2 cost of debt = Pre-tax CO2 cost of debt * (1 – CO2 tax rate) = 58% (new 2020 forecast of CO2 cost of debt but biannual so divide by 2 = 29%)^2(number of times a year) * (1 - 15% (tax rate addressed from Rio+20)) = 0.0715, or 7.15%. • Market value estimate of debt ratio: D/(D+E) = 0.37/1.37 = 0.27. (CO2 Solutions Inc.) • Market value estimate of equity ratio: E/(D+E) = 0.63/1.37 = 0.46. (CO2 Solutions Inc.)
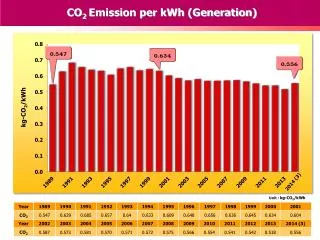
Cost of Capital = Cost of Equity (E/(D+E)) + After-tax Cost of Debt (D/(D+E)) • = 6%(0.46) + 7.15%(0.27) = 0.047, or 4.7%. (CO2 cost of capital) • Cost of Capital for beverage firms in overall = 6.34% (Beveragecost of capital) (from NYU-Stern) • Cost of Capital for water utility industries in overall = 3.46% (Water utility cost of capital) (from NYU-Stern) • Cost of Capital for both beverage and water utility industries in overall = (6.34% * 3.46%) = 0.22% (Beverage & Water utility cost of capital) • Comparison between CO2 cost of capital and Beverage & Water utility cost of capital: • 4.7% / 0.22% = 21.36 times more cost for running CO2.
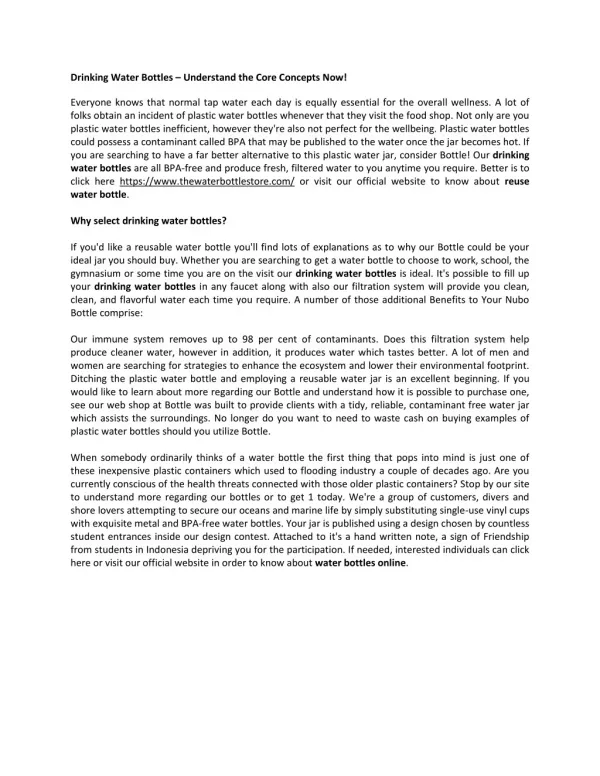
4. Few ways to reduce rampant CO2 emission of water bottles I. Using Reusable Water Bottle and Drink from Tap Water • If you are someone who drinks more than 2 liters of water per day (me), then use reusable water bottle and drink from tap water. (You are saving more than 350 gallons of water annually) Note: one plastic water bottle = 3 times the same amount of water contained in the water bottle + 1/4 times of oil. II. Drink from Tap Water • If you are someone who drinks less than 2 liters of water per day and do not want to fill the water bottles, then just drink from tap water when you have access. • Benefits: Environment Health; More minerals (more conservation of water itself) III. We should be aware of our next generations • Global warming needs to be slowed down. I personally do not believe that we can go back to 1990s. Time to be satisfied with our current level of technology and initiate protection or growth of green nature.