Download
1 / 34
340 likes | 454 Vues
Basic Terms. Population: a group of individuals from the same species that all live in the same area at the same time. Ecology: the study of how populations interact with their environment. Changes in whooping crane population at Wood Buffalo Park . 200. 160. Number of cranes. 120. 80.

E N D
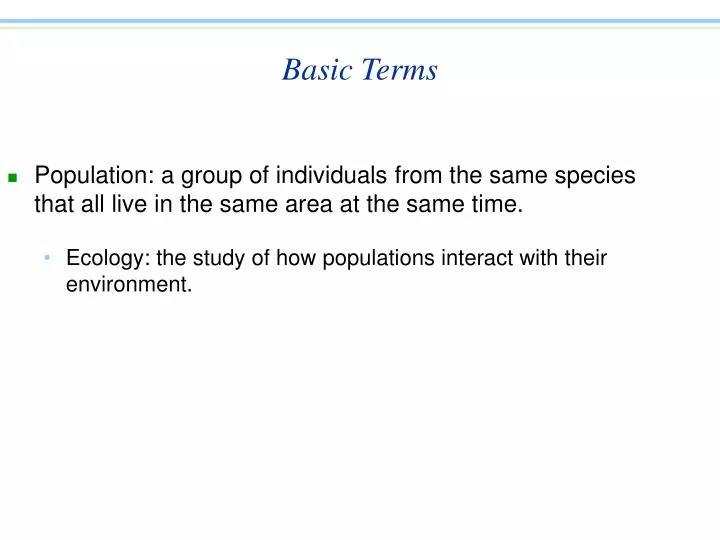
Basic Terms • Population: a group of individuals from the same species that all live in the same area at the same time. • Ecology: the study of how populations interact with their environment.
Changes in whooping crane population at Wood Buffalo Park 200 160 Number of cranes 120 80 40 0 1940 1970 1980 1990 2000 1950 1960 Year
Population Growth • Births and immigration add individuals to any population, while deaths and emigration remove them.
Population Growth • Basic models of population growth • Continuous growth can be represented by the equation: Nt= N0er t
800 = 1.6 Discrete Growth (Nt = N0t) 600 400 200 Population size (N) 0 2 4 0 1 3 800 r = 0.47 600 400 Continuous Growth (Nt = N0ert) 200 0 2 3 0 1 4 Time (t)
Population Growth • Exponential growth • Growth continues indefinitely and is density-independent. • Can occur for short intervals, but cannot be sustained.
Exponential growth High r 500 Moderate r 400 300 Population size (N) 200 Low r 100 Very low r 0 1 5 0 2 3 4 6 7 8 9 10 Generations
Population Growth • Exponential growth • No population can continue to grow indefinitely. • At high densities, growth becomes density-dependent. • All populations eventually reach the carrying capacity of their habitat.
Carrying capacity Population size Time
Case Studies Explaining How Population Size Changes Over Time • Humans exhibiting density-dependent growth • Recovery from trauma: The Exxon Valdez oil spill
Historical growth 6 1999: 6 billion 1900: 1.5 billion 5 1700: 600 million 4 1500: 400 million Human population (billions) 3 1 A.D.: 150–200 million 2 4–5 million 1 0 10,000 B.C. 8000 6000 4000 2000 0 2000 A.D. Year
Recent growth 12 11 10 High 1998 Projections Medium 9 8 Low 7 Human population size (billions) 6 5 4 3 2 1950 1970 1990 2010 2030 2050 Year
1992 Projections Projected population in 2050 Fertility rate 12.5 billion High 10.15 billion Medium Low 7.8 billion The 1992 projections for 2050 are higher than those from 1998 primarily because the earlier projections did not account for the impact of AIDS.
Population Structure • Age structure • Developed nations have an age distribution that tends to be even. • Developing nations have an age distribution that is bottom-heavy (mostly young individuals).
More-developed countries 100 1998 data 95 90 85 2050 projections 80 75 70 65 60 55 50 45 40 35 30 25 20 15 10 5 0 60 40 20 0 20 40 60 (In millions) Females Males
Less-developed countries 100 95 1998 data 90 85 2050 projections 80 75 70 65 60 55 50 45 40 35 30 25 20 15 10 5 0 0 300 200 100 100 200 300 (in millions) Females Males
Population Structure • Geographic structure • Many species exist as a metapopulation. • Small, isolated populations, even those on nature reserves, are unlikely to survive over the long term.
A metapopulation is made up of small, isolated populations. Individuals Habitat patches
Demography and Conservation • Demography: the study of factors that determine the size and structure of populations through time.
Demography and Conservation • Life tables • Summarize the probability that an individual will survive and reproduce in any given year over the course of its lifetime.
Three general types of survivorship curves 1000 Type l High survivorship 100 Type ll Low survivorship Number of survivors (Nx) Low survivorship Steady survivorship 10 1 Type lll High survivorship 0.1 Age
Demography and Conservation • Life tables • Contain useful pieces of information, such as survivorship, fecundity, and net reproductive rate.
Life table Age (x) Survivorship (lx) Fecundity (mx) 0 (birth) 0.0 0.33 3.0 1 2 0.2 4.0 0.2 5.0 3
Demography and Conservation • Life tables • Can be used to make population projections and guide conservation programs.
Demography and Conservation • Population viability analysis (PVA) • A model that estimates the likelihood that a population will avoid extinction for a given time period.
Demography and Conservation • Population viability analysis (PVA) • Populations are considered viable if they have a 95% probability of surviving for at least 100 years.
Demography and Conservation • Population viability analysis (PVA) • Currently being used by natural resource managers.