Download
1 / 73
730 likes | 837 Vues
Understanding and Comparing Remote Sensing Data to Model Output. Chris A. Mattmann Senior Computer Scientist, NASA Jet Propulsion Laboratory Adjunct Assistant Professor, Univ. of Southern California Member, Apache Software Foundation. Roadmap. Motivation Background Earth System Grid, NASA

E N D
Understanding and Comparing Remote Sensing Data to Model Output Chris A. Mattmann Senior Computer Scientist, NASA Jet Propulsion Laboratory Adjunct Assistant Professor, Univ. of Southern California Member, Apache Software Foundation
Roadmap • Motivation • Background • Earth System Grid, NASA • Inserting observations into AR5 • Why is this so difficult? • Data management issues • Architectural issues • Approaches for dealing with observations and models • Approaches for comparing observations to models • Architectural patterns • Example: AIRS Level 2 data to NCAR CCSM model output • Tool support • Wrap-up CORDEX-MATTMANN
And you are? • Apache Member involved in • OODT (VP, PMC), Tika (VP,PMC), Nutch (PMC), Incubator (PMC), SIS (Mentor), Lucy (Mentor) and Gora (Champion), MRUnit (Mentor) • Senior Computer Scientist at NASA JPL in Pasadena, CA USA • Software Architecture/Engineering Prof at Univ. of Southern California CORDEX-MATTMANN
Motivation How to bring as much observational scrutiny as possible to the IPCC process? How to best utilize the wealth of NASA Earth science information for the IPCC process? Credit: Waliser, Teixeira, Crichton, Ferraro CORDEX-MATTMANN
Inserting Observations in the IPCC • Observations play a critical role in climate research • Process understanding • Exploratory data analysis • Hypothesis formulation • Parameterization and model development • Statistical description of sub-grid-scale processes • Hypothesis testing • Model evaluation (IPCC) • Comparison of model output against observations • Weighting multi-model ensemble members (“scoring") • NASA is at a critical juncture in inserting observations into AR5 • Climate research community recognizes the importance of comparing models-to-data • The infrastructures, different formats, etc make this a challenging problem • Time, however, is limited Credit: Amy Braverman CORDEX-MATTMANN
DOE Earth System Grid • Purpose • Provide climate researchers worldwide with access to data, information, models, analysis tools, and computational resources required to make sense of enormous climate simulation datasets • Scope • Petabyte-scale data volumes • Gateway to climate change data products, model outputs and informational sites (i.e., globally federated sites) • Comprehensive registry of climate change Earth Science research results and components • Support climate change and its partner scientists, analysts, data managers, educators and decision makers • Resource to national and international science and societal benefit initiatives • Resource to climate change data products through interoperable web service and climate analysis tools CORDEX-MATTMANN Credit: Dean Williams
ESG Principal Sites CORDEX-MATTMANN Credit: Dean Williams
ESG Conceptual Overview Standard Browser, Web Services Workstation Applications, Thick Clients CORDEX-MATTMANN Credit: Dean Williams
The Next-generation ESG • Independent gateways federating metadata, users. • Individual data nodes responsible for publishing services. • Designed for model output data sets. CORDEX-MATTMANN
ESG Gateways and Nodes • Federated architecture • Federation is a virtual trust relationship among independent management domains that have their own set of services. Users authenticate once to gain access to data across multiple systems and organizations • Gateways • Where data is discovered, requested • Portals, search capability, distributed metadata, registration and user management • May be customized to an institution’s requirements, topical focus • More complex architecture than nodes, fewer sites • Initially PCMDI, NCAR, ORNL, eventually GFDL • Nodes • Where data is stored and published • Data may be on disk or tertiary mass store • Each data node can publish to any gateway (facilitates topical gateways) • Data reduction/analysis • Less complex architecture, including possible minimalist deployment w/o services • Anticipate ~20 data nodes for CMIP5, many others have expressed interest • Sites A site can be both a gateway and a data node CORDEX-MATTMANN Credit: Dean Williams
NASA Distributed Active Archive Centers (DAACs) CORDEX-MATTMANN
NASA Earth Science Data: Broader Picture CORDEX-MATTMANN
Observations in AR5 • In AR4, the Earth System Grid played an input role in providing models for climate research • In AR5, the ESG is being extended as a fully, distributed online data system to support access to climate models via the ESG portals • What is needed, however, is the link to satellite observations and the convergence between the observational and modeling communities The reliability of projections could be improved if the models were weighted according to some measure of skill. . . Since there is no verification for a climate forecast on timescales of decades to centuries, the skill or performance of the models needs to be defined, for example, by comparing simulated patterns of present day climate to observations. Scoping of the IPCC 5th Assessment Report, IPCC Working Group, April 2009 CORDEX-MATTMANN
Long Term Objective • Establish a NASA-wide capability for the climate modeling community to support model-to-data intercomparison: • Ensure observations are available along-side models • Develop a common approach for sharing observations with the climate research community • Leverage existing data systems within NASA and ESG • Ensure that NASA R&A programs have the necessary infrastructure to support model-to-data verification and data analysis • Provide phased capabilities for AR5 and AR6 • Develop a strong collaboration between observation and modeling communities (both science and technical) • JPL and PCMDI have a very good working relationship CORDEX-MATTMANN
Challenges with Observational Data • Massive • They entail detailed information about processes through multivariate distributions on multiple spatial and temporal scales • Heterogeneous • Have variety of organizational structures, retrieval methods, sampling characteristics, and meaning (not like model output!) • Distributed • Are stored all over the country and the world with EOSDIS being a principal infrastructure • Analysis • Access and computational capabilities are needed to assemble and perform analysis “on-the-fly" CORDEX-MATTMANN
Traditional Paradigm • User program must encode all functionality beyond gross-level access. • Requires knowledge of specific instrument characteristics such as retrieval methods, format, measurement error characteristics and biases, etc. • Difficulties multiply with more than one data source. Credit: Braverman, Mattmann, Crichton CORDEX-MATTMANN
Emerging Paradigm • Push as much computation as possible to locations where the data reside; minimize data movement • Deploy simple services to data centers that provide access and the computational functions to enable model-to-data analysis • Embrace service-oriented style of architecture Credit: Braverman, Mattmann, Crichton CORDEX-MATTMANN
Science Data File Formats • Hierarchical Data Format (HDF) • http://www.hdfgroup.org • Versions 4 and 5 • Lots of NASA data is in 4, newer NASA data in 5 • Encapsulates • Observation (Scalars, Vectors, Matrices, NxMxZ…) • Metadata (Summary info, date/time ranges, spatial ranges) • Custom readers/writers/APIs in many languages • C/C++, Python, Java • Most NASA observational data is in HDF format CORDEX-MATTMANN
Science Data File Formats • network Common Data Form (netCDF) • www.unidata.ucar.edu/software/netcdf/ • Versions 3 and 4 • Heavily used in DOE, NOAA, etc. • Encapsulates • Observation (Scalars, Vectors, Matrices, NxMxZ…) • Metadata (Summary info, date/time ranges, spatial ranges) • Custom readers/writers/APIs in many languages • C/C++, Python, Java • Not Hierarchical representation: all flat • Most climate model output is in netCDF CORDEX-MATTMANN
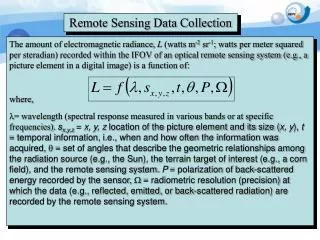
Tools to extract data from scientific data formats? • There are actually quite a few that range from… • GUIs and higher level (more sophisticated) software • R, Matlab, IDL, NCL, etc. • Intermediate APIs: NetCDF-Java, NetCDF C API, HDF4/5 API • Low level, command-line tools • UNIX strings command • One concern: Decimate the binary file format and give you • Metadata (Start/End date time boundaries, spatial boundaries, abstract, investigator name, mission name, etc.) • The actual data • Let’s take an example: Apache Tika: metadata CORDEX-MATTMANN
is… • A content analysis and detection toolkit • A set of Java APIs providing MIME type detection, language identification, integration of various parsing libraries • A rich Metadata API for representing different Metadata models • A command line interface to the underlying Java code • A GUI interface to the Java code • http://tika.apache.org CORDEX-MATTMANN
Bootstrapping • Download Tika from: • http://tika.apache.org/download.html • Grab tika-app-0.9.jar • http://repo1.maven.org/maven2/org/apache/tika/tika-app/0.9/tika-app-0.9.jar • alias tika “java –jar tika-app-0.9.jar” • tika < somefile.doc > extracted-text.xhtml • tika –m < somefile.doc > extracted.met • Works on Windows too (alias only on UNIX) CORDEX-MATTMANN
A quick NASA dataset • Atmospheric Infrared Sounder Mission (AIRS) • Level 2 Cloud Clear Radiance Product • Grab it from here: • ftp://airspar1u.ecs.nasa.gov/ftp/data/s4pa/Aqua_AIRS_Level2/AIRI2CCF.003/2007/005/ • Just grab the first file • java -jar tika-app-0.9.jar -m < AIRS.2007.01.05.001.L2.CC.v4.0.9.0.G07006021239.hdf • Hopefully this worked for you, if not, blame Bruce • And windows • And Bill Gates CORDEX-MATTMANN
So you can get info from the file, what to do with it? • You guys know plenty more about that than me! • However… • Let’s take an example where we want to extract a time series of temp. profile information from AIRS level 2 datasets • …and then, to compare it with model output from the NCAR Community Climate System Model (CCSM) • Compare meaning compute some statistic, e.g., let’s say averages that we can then compare between measured and predicted values CORDEX-MATTMANN
Some initial parameters • AIRS Level 2 Standard Products • HDF4, with HDF-EOS metadata • Housed in several places • AIRS TLSCF (JPL, Pasadena, West Coast) ,NASA GES DISC (Goddard, Maryland, East Coast) • NCAR CCSM model output • NetCDF, with CF metadata • Housed in several places, canonical source is the Earth System Grid • Lawrence Livermore National Laboratory (LLNL), Livermore, CA CORDEX-MATTMANN
What’s the process? CORDEX-MATTMANN
Step 1: AIRS data • Decide on some set of AIRS data to select • Time bounds (e.g., January 2007) • Spatial bounds (lat lon box) • Understand AIRS data • 240 files per day, broken down into 6 minute granules • Each file is in HDF4 format, with measured values for each variable part of the Level 2 std product • Understand the variable name: TAirStd CORDEX-MATTMANN
Step 1a: Obtain AIRS data • Some options • Go to the GES DISC and get the AIRS data from their FTP server – boo! • Get just the AIRS data you need from a web service (OPeNDAP) i.e., subset it – better! • Subset out the TAirStd 45x30 matrix, and only the part of that matrix that you care about that corresponds to your spatial region of interest • Requires that you know what variable is used for lat, lon, and time (stored in separate 45x30 matrices) CORDEX-MATTMANN
Step 1b: • So you’ve got 240 * 31 files = 7440 files • Each one of these is pretty big (order of gigabytes) • Let’s assume 2 GB per file • That would mean you need ~1.5 TB of space just to get your obs data – eeep! • Better idea: • Many of those 7440 files aren’t over your region of interest so discard the ones that aren’t CORDEX-MATTMANN
What’s the process? CORDEX-MATTMANN
Step 2 • Given a subset list of those 7440 files (let’s say 1500 or so) • For each file • Subset out each TAirStd 45x30 matrix from the file (and believe it or not you may not even need all of those 45 x 30 matrices either), which results in a set of data points X = (v) • Subset out lat, lon and time and shove them into the corresponding value to yield a 4-tuple • X = (v, t, lat, lon) CORDEX-MATTMANN
Step 2a • Hidden assumption • Step 2 is easy • IT’S NOT • In fact, Step 2 is usually one of the hardest parts since not all of these NASA or NOAA datasets include a subset function • The datasets themselves may have different temporal properties (compared to models) • AIRS data relevant only at 1:30am and 1:30pm • Different spatial properties too: 500m level CORDEX-MATTMANN
Sample GHRSST L2 Data Set Image Notice that the lines of longitude and latitude are not perfectly straight. This makes it more difficult to locate equator crossings. CORDEX-MATTMANN
What’s the process? CORDEX-MATTMANN
Step 3 • Given a set of data point tuples X = (v, t, lat, lon) • Build up a cube of the form lon by lat by time • “Regrid” the resultant satellite data onto this cube • Make this cube match up to the gridding properties of your model • Maybe 1 deg by 1 deg grid box over the area that you care about • Maybe daily, monthly, hourly: your model will dictate this! CORDEX-MATTMANN
Step 3a • Given a satellite data “regridded cube”, it’s fairly trivial to compute stats on that cube that matches up to the model • Averages/time – sum lat/lon 2d sheet for each sheet over time (the z axis in the cube) • Means/time – derive mean for lat/lon 2d sheet over time (the z axis in the cube) • Etc etc CORDEX-MATTMANN
OK the schedule says I’ll talk about a tool • …so OK, I’ll mention one that we are building at JPL called the Regional Climate Model Evaluation System (RCMES) • RCMED and RCMET • Caveats • Certain parts of this tool are still in development • Portions of the tool are difficult to install • Things I hate love: NCL, PyNIO, PyNGL, matplotlib, scipy, numpy • Good news • We’re trying to make the tool easier to install • We are building the tool as an open source system CORDEX-MATTMANN
RCMED TRMM ERA-Int RCMED Observation database RCMET Evaluation tool front-end Model file MODIS Extractors www CRU client-side (user’s local machine) AIRS server-side (hosted at JPL) CORDEX-MATTMANN
Datasets included • MODIS (satellite cloud fraction): [daily 2000 – 2010] • TRMM (satellite precipitation): 3B42 [daily 1998– 2010] • AIRS (satellite surface + profile retrievals) [daily 2002 – 2010] • ERA-Interim (reanalysis): [daily 1989 – 2010] • NCEP Unified Rain gauge Database (gridded precipitation): • [daily 1948 – 2010] • CRU TS 3.0: precipitation, Tavg, Tmax, Tmin [monthly 1901 – 2006] Level 3: T(2m), T(p), z(p) T(2m), Td(2m), T(p), z(p) CORDEX-MATTMANN
How do RCMET and RCMED talk? TRMM ERA-Int RCMED Observation database RCMET Evaluation toolkit Model file MODIS Extractors www CRU client-side (user’s local machine) AIRS server-side (hosted at JPL) CORDEX-MATTMANN
Programmatic Access The RCMED API: - Search the entire database - Space/Time box - Simple RESTful URL - Simple ASCII result format CORDEX-MATTMANN
Recall: this would be what you need for step 2.5 CORDEX-MATTMANN
RCMED Web-Based Access The RCMED Data Portal: - Database Statistics - Project information - Advanced search options - Data product download - Query API for 3rd Party Scripts CORDEX-MATTMANN
RCMET TRMM ERA-Int RCMED Observation database RCMET Evaluation tool front-end Model file MODIS Extractors www CRU client-side (user’s local machine) AIRS server-side (hosted at JPL) CORDEX-MATTMANN
Collect User Choices (GUI / command line) RCMED Observation database Model file Retrieve obs from database Load model data Spatial re-gridding onto common grid e.g. map, time series plot, Taylor diagram e.g. calculate means of all Januarys, all Februarys etc e.g. calculate bias, RMS error etc e.g. calculate monthly means from daily data e.g. calculate area-weighted mean over user defined masked region Time averaging optional Area -averaging RCMET Annual cycle compositing Metric Calculation Plot production CORDEX-MATTMANN
What we’re working on • Annual cycle compositing • Area-averaging: • Full domain • User defined lat/lon bounding box • User supplied mask in netCDF file • Metrics: • Mean error (bias), RMS error, Mean Absolute Error, Pattern Correlation, Anomaly Correlation, Probability Distribution Function • Plots: • Time series • Map plots • Taylor Diagram CORDEX-MATTMANN
Demo • If this doesn’t work I have backup slides • Cross your fingers • And if it doesn’t work, I blame Bruce, Chris, Richard, Bill, Hassan et al. for keeping me out last night CORDEX-MATTMANN
Lessons Learned • Separating out RCMED and RCMET • = GOOD • Allows for each to evolve independently • Keep adding satellite observations, analysis tool just reaps the benefits without having to know or care about formats, temporal differences, spatial differences, etc. • RCMET installation on client machine • …ehhh, not always so good • RCMET has a tightly coupled dep on RCMED CORDEX-MATTMANN
Thoughts • Bandwidth limited in Africa • Option 1: Couple RCMED and RCMET-like system closely together • Stand up RCMES (coupled system) • Easily add new datasets, new plots, new stats, etc. • Bandwidth limitation more easily dealt with due to closeness • Option 2: Provision RCMES as a web-ui near a data center with lots of bandwidth • Allows for true “thinlet” apps, either browser or phone CORDEX-MATTMANN
Alright, I’ll shut up now • Any questions? • THANK YOU! • mattmann@apache.org • chris.a.mattmann@nasa.gov • @chrismattmann on Twitter CORDEX-MATTMANN