Download
1 / 35
350 likes | 374 Vues
Explore the challenges and significance of SNP risk factor searching in case-control studies for common complex diseases. Learn about genetic models, computational algorithms, and statistical approaches for identifying risk factors. Discover how to address scalability and reproducibility issues in disease association research.

E N D
February 21, 2008 Risk Factor Searching Heuristics for SNP Case-Control Studies Dumitru Brinza Department of Computer Science & Engineering University of California at San Diego
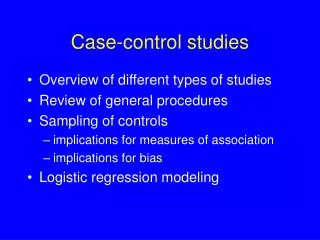
Outline • SNPs, Genotypes, Common Complex Diseases • Disease Association Search in Case-Control Studies • Computational challenges • Significance and Reproducibility of RF • Genetic model / Atomic Risk Factor • Maximum Odds Ratio Risk Factors • Exhaustive Search • Complimentary Greedy Search Algorithm • K-Relaxed and Weighted Atomic Risk Factor • WCGS Algorithm for finding K-ARF and W-ARF • Dataset • Results • Conclusions
SNP, Haplotypes, Genotypes • Human Genome – all the genetic material in the chromosomes,length 3×10⁹ base pairs • Difference between any two people occur in 0.1% of genome • SNP – single nucleotide polymorphism site where two or more different nucleotides occur in a large percentage of population. • Diploid – two different copies of each chromosome • Haplotype – description of a single copy (expensive) • example: 00110101 (0 is for major, 1 is for minor allele) • Genotype – description of the mixed two copies • example: 01122110 (0=00, 1=11, 2=01)
Heritable Common Complex Diseases • Monogenic disease • Mutated gene is entirely responsible for the disease • Break the pathway, no another compensatory pathway • Typically rare in population: < 0.1%. • Complex disease • Interaction of multiple genes • One mutation does not cause disease • Breakage of all compensatory pathways cause disease • In case of cancer – breakage of several cell functions cause disease, e.g., cell-growing and cell-checking systems • Hard to analyze - 2-gene interaction analysis for a genome-wide scan with 1 million SNPs has 1012 pair wise tests • Multiple independent causes • There are different causes and each of these causes can be result of interaction of several genes • Each cause explains certain percentage of cases • Common diseases are Complex: > 0.1%. • In NY city, 12% of the population has Type 2 Diabetes
DA Search in Case/Control Study Given: a population of n genotypes each containing values of m SNPs and disease status Disease Status SNPs -1 -1 -1 -1 1 1 1 1 0101201020102210 0220110210120021 0200120012221110 0020011002212101 1101202020100110 0120120010100011 0210220002021112 0021011000212120 Case genotypes: Control genotypes: Find:risk factors (RF) with significantly high odds ratio i.e., pattern/dihaplotype significantly more frequent among cases than among controls
Challenges in Disease Association • Computational – Scalability • Interaction of multiple genes/SNP’s • Too many possibilities – obviously intractable • Multiple independent causes • Each RF may explain only small portion of case-control study • Statistical – Reproducibility • Search space / number of possible RF’s • Adjust to multiple testing • Searching engine complexity • Adjust to multiple methods / search complexity
Addressing Challenges in DA • Computational– Scalability • Constraint model / reduce search space • Negative effect = may miss “true” RF’s • Heuristic search • Look for “easy to find” RF’s • May miss only “maliciously hidden” true RF • Statistical – Reproducibility • Validate on different case-control study • That’s obvious but expensive • Cross-validate in the same study • Usual method for prediction validation
Significance of Risk Factors OR= TP/FP TN/FN Original Case Control Have RF Case True Positive False Positive (TP) (FP) Control False Negative True Negative (FN) (TN) Significance of Risk Factors • Relative risk (RR) • cohort study • Odds ratio (OR) – case-control study • P-value • binomial distribution • multiple testing adjustment of the p-value: • more searching more findings by chance
Reproducibility Control • Multiple-testing adjustment • Bonferroni: • adjusted p = # possibilities x unadjusted p • easy to compute but overly conservative • SNP’s are linked – difficult to take in account • Randomization • 10000 times repeat: • Randomly permute disease status • Find the best RF using the same method • adjusted p = # times RF has higher OR than found • computationally expensive but ideally accurate
Risk/Resistance factors • Previous works model Risk/resistance factor =one SNP with fixed allele value 0 1 1 0 1 2 1 0 2 case 0 1 1 1 0 2 0 0 1 case 0 0 1 0 0 0 0 2 1 case 0 1 1 1 1 2 0 0 1 case 0 0 1 0 1 2 1 0 2 case 0 1 0 0 1 1 0 0 2 control 0 1 1 0 1 2 0 0 2 control present in 5 cases : 1 control Third SNP with fixed allele value 1 is a risk factor with frequency among case individuals higher than among control individuals.
Genetic Model 1 4 2 5 End Product 3 Genetic Model Cellular Pathway • Breaking1 & 2 does not imply disease because of compensatory link 3 • Breaking1 & 2 & 3 imply disease = “atomic” risk factor • Breaking 1 & 2 & 3 or 4& 5 imply disease = “complex” RF • Several causes of disease (ARFs) 1 & 2 & 3 or 4 & 5 • ARF ↔ multi-SNP combination (MSC)
Multi-SNP Combination and Cluster • Multi-SNP combination (MSC) • a subset ofSNP-columns of S (set of SNPs) • With fixed values of these SNPs, 0, 1, or2 0 1 1 0 1 2 1 0 2 case 0 1 1 1 0 2 0 0 1 case 0 0 1 0 0 0 0 2 1 case 0 1 1 1 1 2 0 0 1 case 0 0 1 0 1 2 1 0 2 case 0 1 0 0 1 1 0 0 2 control 0 1 1 0 1 2 0 0 2 control x x 1 x x 2 x x x MSC present in 4 cases : 1 control Cluster= subset of genotypes with the same MSC
MORARF formulation • Maximum Odds Ratio Atomic Risk Factor • Given: genotype case-control study • Find: ARF with the maximum odds ratio • Number of RF is enormous large • Constrain searching among Atomic Risk Factors
Exhaustive Searching Approaches • Exhaustive search (ES) • For n genotypes with m SNPs there are O(3km) k-SNP MSCs • Exhaustive Combinatorial Search (CS) • Drop small (insignificant) clusters • Search only plausible/maximal MSC’s Case-closure of MSC: • MSC extended with common SNPs values in all cases • Minimum cluster with the same set of cases i i 0 1 1 0 1 2 1 0 2 case 0 1 1 0 1 2 1 0 2 case Case-closure 2 0 1 1 0 2 0 0 1 case 2 0 1 1 0 2 0 0 1 case 0 0 1 0 0 0 0 2 1 case 0 0 1 0 0 0 0 2 1 case 0 1 1 0 1 2 0 0 2 control 0 1 1 0 1 2 0 0 2 control 0 1 1 0 1 2 0 1 2 control 0 2 1 0 1 2 0 1 2 control x x 1 x x 2 x x x x x 1 x x 2 x 0 x Present in 2 cases : 2 controls Present in 2 cases : 1 control
Cases Controls Cases Controls Cases Controls Exhaustive Combinatorial Search • Exhaustive Combinatorial Search Method (CS): • Searches only among case-closed MSCs • Avoids checking of clusters with small number of cases • Alternating Combinatorial Search method (ACS): • Find significant MSCs faster than ES • Still too slow for large data • Further speedup by reducing number of SNPs • Indexing:compress S by extracting most informative SNPs • Use multiple regression method
Heuristics for MORARF • Clusters with less controls have higher OR => MORARF includes finding of max control-free cluster • max control-free cluster contains max independent set problem => NP-hard • max control-free cluster can be transformed to Red-Blue Set Cover Problem • Cannot be reasonably approximated in polynomial time for an arbitrary S • Red-Blue Set Cover Problem includes weighted set-cover problem • The best known approximation algorithm for the weighted set-cover problem is greedy heuristic
Complimentary Greedy Search(CGS) • Intuition: • Greedy algorithm for finding maximum independent set by removing highest degree vertices • Fixing an SNP-value • Removes controls -> profit • Removes cases -> expense • Maximize profit/expense! • Algorithm: • Starting with empty MSC add SNP-value removing from current cluster max # controls per case • Result is maximum control free cluster MORARF Cases Controls
OR after each iteration of CGS The value of OR of ARF with 95% CI on i-th iteration of CGS on lung-cancer dataset
Complimentary Greedy Search(CGS) • Comparison with optimum: • For the small dataset of Tick-borne encephalitis we were able to find an optimal solution for MORARF using ILP. • CGS founds the same solution. • We can assume that CGS founds the optimal or close to optimal solution.
Randomized CGS Repeat 100 times and choose the best MSC Empty MSC Empty MSC CASES 1/4 1/2 CONTROLS 1
5 Data Sets • Crohn's disease (Daly et al ):inflammatory bowel disease (IBD). Location: 5q31 Number of SNPs: 103 Population Size: 387 case: 144 control: 243 • Autoimmune disorders (Ueda et al) : Location: containing gene CD28, CTLA4 and ICONS Number of SNPs: 108 Population Size: 1024 case: 378 control: 646 • Tick-borne encephalitis (Barkash et al) : Location: containing gene TLR3, PKR, OAS1, OAS2, and OAS3. Number of SNPs: 41 Population Size: 75 case: 21 control: 54 • Lung cancer (Dragani et al) : Number of SNPs: 141 Population Size: 500 case: 260 control: 240 • Rheumatoid Arthritis (GAW15) : Number of SNPs: 2300 Population Size: 920 case: 460 control: 460
Search Results Comparison of 5 methods searching ARF on 5 real datasets
Validation Results 2-fold Cross-validation = % of best MSC on the training validated on testing half (p < 5%) Random-validation = the same but testing is allowed to overlap with training Significance = % of best MSC on the training half significant after MT-adjustment Double Significance = % of best MSC on the training half significant after MT-adjustment that are also significant on the testing half
Generalization of ARF wild type mutation P P (a) Atomic Risk Factor P P (b) 1-Relaxed Atomic Risk Factor P P (c) Weighted Relaxed Atomic Risk Factor
k-Relaxed Atomic Risk Factor • k-MSC • MSC with n SNPs • a subset ofSNP-columns of S (set of SNPs) • With fixed values of these SNPs, 0, 1, or2 • Threshold k • k-neighborhood of MSC = at most k mismatches 0 1 1 0 1 2 1 0 2 case 0 1 1 1 0 2 0 0 1 case 0 0 0 0 0 2 0 2 2 case 0 1 1 1 1 2 0 0 1 case 0 0 1 0 1 0 1 0 2 case 0 1 0 0 1 1 0 0 0 control 0 1 1 0 1 2 0 0 1 control 1-MSC x x 1 x x 2 x x 2 present in 5 cases : 1 control k-Cluster = subset of genotypes satisfying k-MSC
Example of 1-MSC MSC1 Sick individuals k-MSC MSC2 k-Cluster
MORRARF Formulation • Maximum Odds Ratio k-RARF • Given: genotype case-control study and constant k • Find: k-RARF with the maximum odds ratio • MORRARF includes MORARF => harder • k-CGS Algorithm: • CGS with objective computed for the k-cluster instead of cluster
Weighted k-Relaxed ARF • Weighted k-MSC • k-MSC with weights on each SNP 0 1 1 0 1 2 1 0 2 case w(2)=2+1-1 0 1 1 1 0 2 0 0 0 case w(3) 0 0 0 0 0 2 0 2 2 case w(0)=1-1 0 1 1 1 1 2 0 0 0 case w(3) 0 0 1 0 1 0 1 0 2 case w(1) 0 1 0 0 1 1 0 0 0 control w(0) 0 1 1 0 1 2 0 0 1 control w(3) x x 1 x x 2 x x 2 MSC weights 0 0 2 0 0 10 0 -1 and k = 2 present in 3 cases : 1 control Weighted k-cluster = subset of genotypes within a weighted distance k from weighted k-MSC
MORWRARF Formulation • Maximum Odds Ratio WRARF • Given: genotype case-control study • Find: Weighted k-RARF with the maximum odds ratio • MORWRARF includes MORARF => harder • WCGS Algorithm: • Two move CGS with objective computed for the k-cluster instead of cluster
One iteration of Greedy Methods CGS/k-CGS WCGS (∆D/∆H)max Step backward ∆D ∆H H = number of controls H = number of controls ∆H ∆H (∆H/∆D)max step forward (∆H/∆D)max step forward ∆D ∆D D = number of cases D = number of cases (a) (b) Cluster content
Cluster content Tick-borne encephalitis 240 H=# Health in k-cluster 260 S = # Sick in k-cluster
Behavior of Greedy Heuristics (a) Lung cancer (b) Rheumatoid Arthritis (c) Tick-borne encephalitis (d) Crohn's disease
Validation Results Cross-validation = % best MSC on the training half validated on testing half (p < 5%) Random-validation = the same but testing is allowed to overlap with training Significance = % best MSC on the training half significant after MT-adjustment Double Significance = % of best MSC on the training half significant after MT-adjustment that are also significant on the testing half
Conclusions • Approximate search methods find more significant RF’s • RF found by approximate searches have higher cross-validation rate • Significant MSC’s are better cross-validated • WCGS has finds significant MSC’s when no other methods could find anything