Download
1 / 14
170 likes | 474 Vues
Precision Agriculture in Europe. Olga S. Walsh BIOEN/SOIL 4213 Spring 2007. EU: “United in Diversity”. The EU - established in 1957 Currently - 27 member states Area = 4,3 mill km² ( 2.7 mill miles 2 ) Agric. land & forests account for 90% of total EU land

E N D
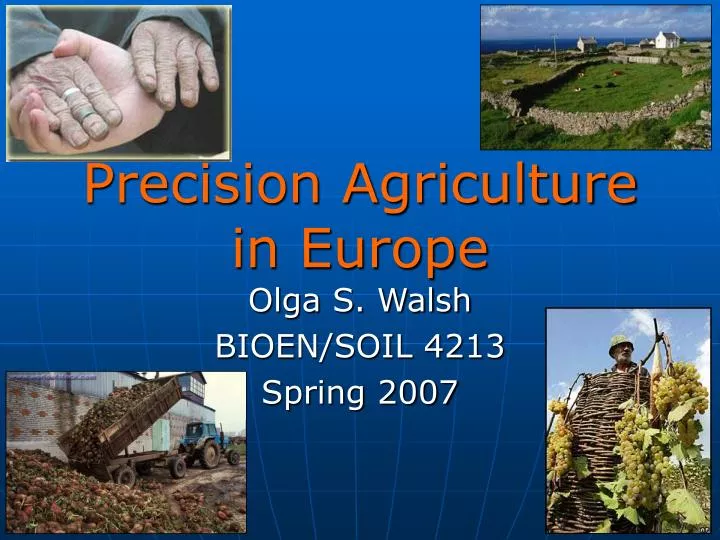
Precision Agriculturein Europe Olga S. Walsh BIOEN/SOIL 4213 Spring 2007
EU: “United in Diversity” • The EU - established in 1957 • Currently - 27 member states • Area = 4,3 mill km² (2.7 mill miles2) • Agric. land & forests account for 90% of total EU land • Population = 493 million • 60% of population = Farming community • Average farm size = 12 ha2 (30 ac2) F + C Source:http://europa.eu (2007)
“The land is extremely variable, which causes yields and therefore profits to differ considerably across a field. This was what first sparked my interest in precision farming." J. Wilson • EU: increased awareness on pollution • Fertilizer N use control • in Nitrate Vulnerable Zones • Government on total N for cereals: • 180 kg N ha-1 for wheat • Before: ½ of N in Fall + 4 dozes mid season • Now: very little preplant + all N mid season • Have to be more N-efficient • Variable-rate application "It is not the strongest that survive, nor the most intelligent, but the ones most responsive to change." Charles Darwin Source: http://www.soilessentials.co.uk/
Source: http://www.soilessentials.co.uk/ A Step Further J. Wilson R. Ramsay R. Watson Goal:to provide the best possible advice, services and products to the arable farming community, delivering increases in precision, efficiency, and profitability. Services: Soil Sampling Yield & Data AnalysisYield AnalysisProfit MappingField TrialsFertilizer PlanningVariable N Application Products: Yield MonitorsGlobal Positioning Systems (GPS)Variable Rate Controllers Software
Yara N Sensor (Germany) Since 1998 • Passive sensor: • Measures sunlight reflected by the crop (4 angles) • Simultaneously measures the ambient light • Permanent correction for light conditions. Sensing area = 50m2 Source: www.bse.unl.edu (2005)
Yara N Sensor (Germany) Since 1998 Increased NUE Increased grain yield Increased grain quality Increased gross margin = 12% 5 Years (UK): Return on capital = 133% • Algorithms: • Winter & Spring Wheat • Winter & Spring Barley • Winter Oilseed Rape • Potatoes Cost = US $15,000 400 Yara sensors operate on farms in 20 countries Source: www.bse.unl.edu (2005)
Yara N Sensor System Source: www.bse.unl.edu (2005)
Optimum N rate : N Tester or N Plan. N Plan - top dressing service N Tester – equivalent of a chlorophyll meter • Calculates economic optimum N requirement • Accounts for: rainfall, soil type, previous cropping. • Chlorophyll leaf content related to N status. • 30 random readings across the field = average used to determine N requirements • Net Return = US $ 40-45/ha Source: www.yara.com (2007) YARA N sensor varies N rate Recommendation around the average optimum.
Source: www.yara.com (2007) ALSN-Sensor Active Light Source Detect plant N status & Crop biomass On-the-go VRA Irrespective of light conditions Cost = US $20,000 Software for various crops Algorithms developed using long-term trial data
INPUTS: Field name & date Soil type Previous management Rainfall Stocking rate WILL OBTAIN MORE ACCURATE FERTILIZER RECOMMENDATION MUST KNOW SITE SPECIFIC INFORMATION OUTPUTS: N, P2O5, K2O reccomendations Wheat Oilseed rape Oats Potatoes Sugar beet Peas & beans Beef Sheep Dairy Silage Forage + Source: www.yara.com (2007)
(Germany) Since 2004 CROP METER Variable Rate application: N fertilizer Stem stabilizers Fungicides • Arrangement of a 3-point mounted device in front of a tractor • Bending resistance of the cereal stems is highly related to the mass of the stems Source: www.agrocom.com (2007)
CROP METER Electronic box Inclination sensor VIDEO Potentiometer Frame Pendulum body Surface sensor rod Mass = 40kg; Working width = 1 m Voltage = 12V; Energy consumption = 50W Source: Ehlert and Dammer (2006)
CROP METER • Application rates are calculated based on: • Pendulum swing • Farmer preset values • Values transferred to computer on spreader • Cost = US $ 7,000 Increased NUE Increased yield = 3 % Reduced N fertilizer rate = 15% Fertilizer N savings = 10 kg N ha Reduced fungicide & growth regulator rates = 20-25% Average savings = US $15 – 40/ha Source: Ehlert and Dammer (2006)