Download
1 / 38
380 likes | 506 Vues
Introduction to Hierarchical Clustering Analysis. Pengyu Hong 09/16/2005. Data 1. Data 2. …. Data N. Background. Cell/Tissue 1. Cell/Tissue 2. …. Cell/Tissue N. Put similar samples/entries together. Background.

E N D
Introduction to Hierarchical Clustering Analysis Pengyu Hong 09/16/2005
Data 1 Data 2 … Data N Background Cell/Tissue 1 Cell/Tissue 2 … Cell/Tissue N Put similar samples/entries together.
Background • Clustering is one of the most important unsupervised learning processes that organizing objects into groups whose members are similar in some way. • Clustering finds structures in a collection of unlabeled data. • A cluster is a collection of objects which are similar between them and are dissimilar to the objects belonging to other clusters.
Motivation I • Microarray data quality checking • Does replicates cluster together? • Does similar conditions, time points, tissue types cluster together?
Data: Rat Schizophrenia Data (Allen Fienberg and Mayetri Gupta) • Two time points:35 days (PD 35) and 60 days (PD60) past birth. • Two brain regions: Prefrontal cortex (PFC) and Nucleus accumbens (NA). • Two replicates (Samples are from the same set of tissue split into different tubes so that replicates should be in close agreement.) • dChip was used to normalize the data and get model-based expression values, using the full PM/MM model. Sample IDs How to read this clustering result? Gene IDs Clustering results Heat map Link length Problem?
Motivation II • Cluster genes Prediction of functions of unknown genes by known ones
Functional significant gene clusters Two-way clustering Sample clusters Gene clusters
Motivation II • Cluster genes Prediction of functions of unknown genes by known ones • Cluster samples Discover clinical characteristics (e.g. survival, marker status) shared by samples.
Bhattacharjee et al. (2001) Human lung carcinomas mRNA expression profiling reveals distinct adenocarcinoma subclasses. Proc. Natl. Acad. Sci. USA, Vol. 98, 13790-13795.
Motivation II • Cluster genes Prediction of functions of unknown genes by known ones • Cluster samples Discover clinical characteristics (e.g. survival, marker status) shared by samples • Promoter analysis of commonly regulated genes
Promoter analysis of commonly regulated genes David J. Lockhart & Elizabeth A. Winzeler, NATURE | VOL 405 | 15 JUNE 2000, p827
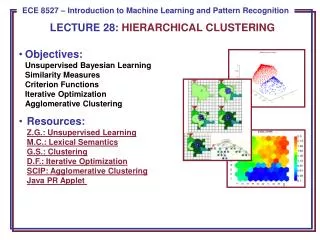
Clustering Algorithms • Start with a collection of n objects each represented by a p–dimensional feature vector xi , i=1, …n. • The goal is to divide these n objects into k clusters so that objects within a clusters are more “similar” than objects between clusters. k is usually unknown. • Popular methods: hierarchical, k-means, SOM, mixture models, etc.
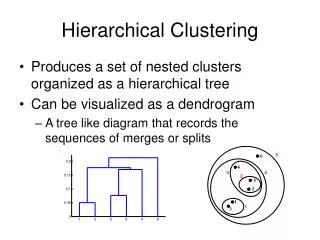
Hierarchical Clustering Venn Diagram of Clustered Data Dendrogram From http://www.stat.unc.edu/postscript/papers/marron/Stat321FDA/RimaIzempresentation.ppt
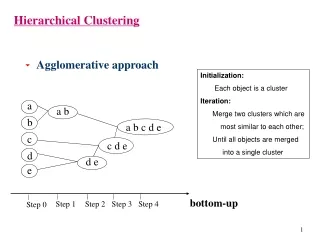
Hierarchical Clustering (Cont.) • Multilevel clustering: level 1 has n clusters level n has one cluster. • Agglomerative HC: starts with singleton and merge clusters. • Divisive HC: starts with one sample and split clusters.
NearestNeighborAlgorithm • Nearest Neighbor Algorithm is an agglomerative approach (bottom-up). • Starts with n nodes (n is the size of our sample), merges the 2 most similar nodes at each step, and stops when the desired number of clusters is reached. From http://www.stat.unc.edu/postscript/papers/marron/Stat321FDA/RimaIzempresentation.ppt
Nearest Neighbor, Level 2, k = 7 clusters. From http://www.stat.unc.edu/postscript/papers/marron/Stat321FDA/RimaIzempresentation.ppt
Hierarchical Clustering Calculate the similarity between all possible combinations of two profiles • Keys • Similarity • Clustering Two most similar clusters are grouped together to form a new cluster Calculate the similarity between the new cluster and all remaining clusters.
Similarity Measurements • Pearson Correlation Two profiles (vectors) and +1 Pearson Correlation – 1
Similarity Measurements • Pearson Correlation: Trend Similarity
Similarity Measurements • Euclidean Distance
Similarity Measurements • Euclidean Distance: Absolute difference
Similarity Measurements • Cosine Correlation +1 Cosine Correlation – 1
Similarity Measurements • Cosine Correlation: Trend + Mean Distance
Similarity Measurements Similar?
Clustering C1 Merge which pair of clusters? C2 C3
Clustering Single Linkage Dissimilarity between two clusters = Minimum dissimilarity between the members of two clusters + + C2 C1 Tend to generate “long chains”
Clustering Complete Linkage Dissimilarity between two clusters = Maximum dissimilarity between the members of two clusters + + C2 C1 Tend to generate “clumps”
Clustering Average Linkage Dissimilarity between two clusters = Averaged distances of all pairs of objects (one from each cluster). + + C2 C1
Clustering Average Group Linkage Dissimilarity between two clusters = Distance between two cluster means. + + C2 C1
Considerations • What genes are used to cluster samples? • Expression variation • Inherent variation • Prior knowledge (irrelevant genes) • Etc.
Take Home Questions • Which clustering method is better? • How to cut the clustering tree to get relatively tight clusters of genes or samples?