Download
1 / 11
120 likes | 261 Vues
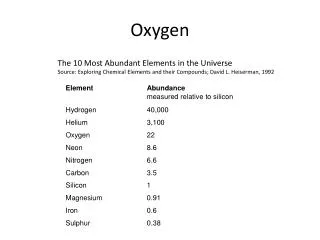
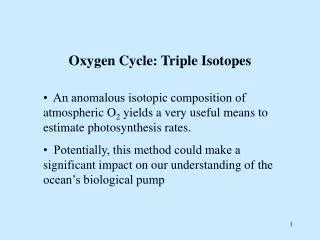
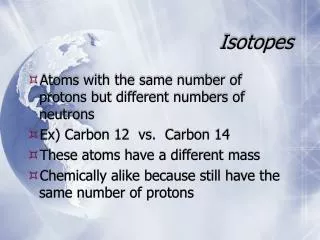
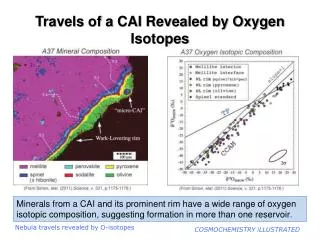
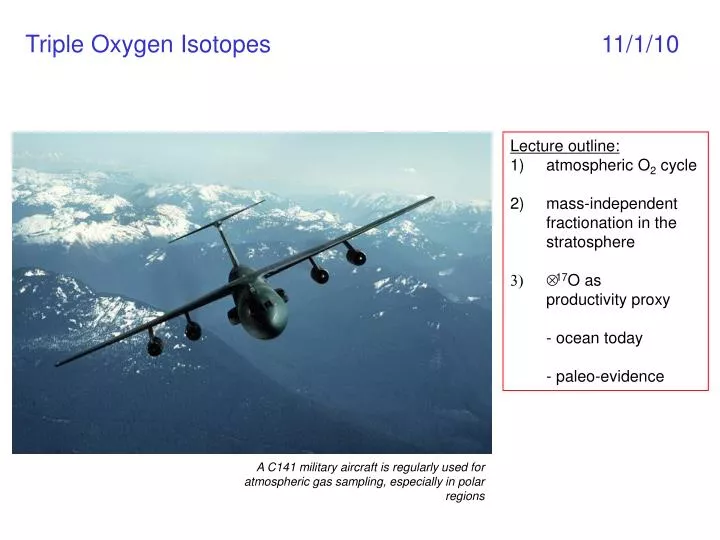
Triple Oxygen Isotopes 11/1/10. Lecture outline: atmospheric O 2 cycle mass-independent fractionation in the stratosphere Δ 17 O as productivity proxy - ocean today - paleo-evidence.

E N D
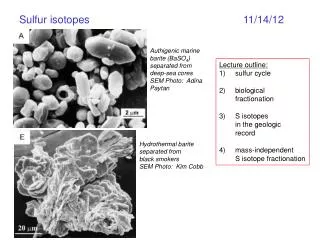
Triple Oxygen Isotopes 11/1/10 • Lecture outline: • atmospheric O2 cycle • mass-independent • fractionation in the • stratosphere • Δ17O as • productivity proxy • - ocean today • - paleo-evidence A C141 military aircraft is regularly used for atmospheric gas sampling, especially in polar regions
Joe Berry, News & Views, 1999 The O2 cycle • Three main reactions: • photosynthesis – mass-dependent fractionation (δ17O = 0.5*δ18O) • respiration – mass-dependent fractionation • stratospheric O3 – mass-independent fractionation (δ17O = δ18O) isotopic composition of O2 depends on who’s winning Stratospheric rxns:
Mass-independent fractionation of O in stratosphere This anomalous O2“leaks” into the troposphere, enters biosphere, and becomes fractionated along mass-dependent line. Can define anomalous 17O signal as: average air used as standard, reported as parts per meg (1 in 106) empirically determined Thiemens and Heidenreich, 1983; Theimens, 1999 (review)
Thiemens et al., GRL, 1995 Isotopic analysis of CO2 samples collected in S.H. at various altitudes Which are the high-altitude samples? Why? But I thought we said that the stratospheric signal was a depletion of 17O relative to the mass-dependent line? So Thiemens proved that the Δ17O anomaly is generated in the upper stratosphere ENDMEMBER #1 Why the large difference in analytical error between 14CO2 and 17CO2?
Closed biological system – steady state Δ17O (wrt air)? steady state Luz et al., GRL, 1999 “steady state” mass-dependent O2 falls on this line (from samples above), defines a mass-dependent end-member, vs. the mass-independent stratsopheric endmember d17O slope = 0.52 intercept 0.155 ENDMEMBER #2 d18O
Mass-independent oxygen fractionation schematic NOTE: these authors are using tropospheric air (HLA) as their standard for δ17O, δ18O, Δ17O - contains signature of stratospheric 17O anomaly All of these fluxes are in steady state. Idea: A change in any of these fluxes will result in a new steady state value of tropospheric and surface ocean Δ17O of O2. Luz et al., 1999
Triple oxygen Isotopes as measure of ocean productivity • Idea: • 1) measure O2 conc in surface water • 2) measure Δ17O in surface water • Three scenarios: • If photosynthesis > respiration, • then [O2]> saturation, Δ17O > water • in equilibrium w/air • 2) If respiration > photosynthesis, • then [O2}< saturation, Δ17O > water • in equilibrium w/air • 3) if no biological activity, • then [O2] = saturation, Δ17O = water • in equilibrium with air How is ocean productivity traditionally measured? satellite photo coccolithophore bloom off Newfoundland
Ocean Net Productivity – model and results Bender, Perspective, Science 2000 Luz and Barkan, 2000 Tracers for net and gross production. Δ17O and [O2]/[O2]sat values for seawater at equilibrium with air. Black lines: Coevolution of 17O and [O2]/[O2]sat for photosynthesis and respiration in a closed system. Coevolution lines are plotted for net/gross production > 0 [photosynthesis (P) > respiration (R)] and < 0 (P < R). Data points are for the euphotic zone of the Atlantic Ocean near Bermuda on 7 July 1998. The ratio of net/gross O2 production, which can be read from this diagram, is ~0.05 in the mixed layer (top 10 m) and 0.1 in the upper part of the euphotic zone (depth of 20 to 60 m).
Using Δ17O to calculate past biosphere production in ice cores Luz et al., 1999 RESULTS Hmmmm… productivity didn’t change by much during glacial but terrestrial biosphere was significantly reduced …. ocean productivity must have increased during the glacial to compensate the loss of terr. productivity
Using Δ17O to calculate past biosphere production in ice cores: a continuous Δ17O record • Observations: • GISP and Antarctic values • similar within error • - glacial values are higher • Facts: • CO2 lower during • glacial • (should increase Δ17O) • land productivity • diminished (fewer • trees; should decrease • Δ17O) • So what about glacial • ocean productivity?? Crosses = GISP2 Triangles = Siple Dome Blunier et al., 2002
Causes of glacial Δ17O enrichment CO2 is the stepping stone for anomalous O2 formation; less CO2 = less anomalous O2; values trend towards biologic (+155 per meg) • this effect clearly dominated glacial Δ17O values • model suggests that CO2 should have caused a much larger • increase in Δ17O (+70 per meg vs. observed +38 per meg) • -so imply an 80% reduction in productivity during the glacial • -if land reduced, then ocean productivity may not have changed • (-88 to +140% poorly constrained)