Download
1 / 28
290 likes | 423 Vues
National Aeronautics and Space Administration. Tree Ring Analysis through Satellite Data. Preston Lewis, SSAI/NASA Langley Research Center Earth to Sky Workshop, Harpers Ferry, WV, February 3, 2010. www.nasa.gov. Mission Statements. The National Park Service :

E N D
National Aeronautics and Space Administration Tree Ring Analysis throughSatellite Data Preston Lewis, SSAI/NASA Langley Research Center Earth to Sky Workshop, Harpers Ferry, WV, February 3, 2010 www.nasa.gov
Mission Statements The National Park Service : Preserves unimpaired the natural and cultural resources and values of the national park system for the enjoyment, education, and inspiration of this and future generations. U.S Fish and Wildlife Service : Working with others, is to conserve, protect, and enhancefish and wildlife and their habitats for the continuing benefit of the American people. National Aeronautics and Space Administration : To improve life here, To extend life to there, To find life beyond.
What NASA Looks at on Earth • Atmosphere • Biosphere • Cryosphere • Land Surfaces • Oceans The satellites of NASA’s Earth Observing System monitor daily events and long term changes. (NASA image by Jenny Mottar.)
MY NASA DATA Site Selections
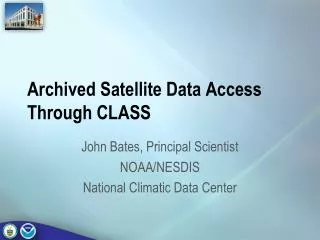
Data Access DATA ACCESS
Live Access Server Choices Live Access Server -Tutorials -Server Selection
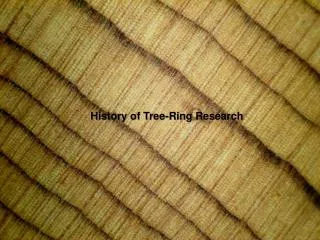
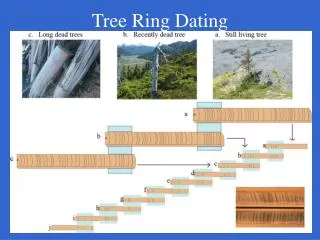
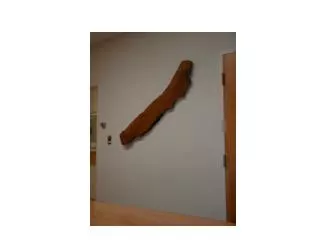
Tree Information Virginia Pine: PinaceaePinusvirginiana Location: Kenbridge VA Longitude: 81.2 W Latitude: 36.2N Cut Down: 2009 Age: 29 years
Items of Interest 1. Very thin dark ring? 2. Rather thick dark ring? 3. Consistent decrease in ring thickness 1997 1988
1. Very Thin Dark Ring? -Lower amounts of rainfall in the summer cause the presence of a very thin summer growth ring.
1. Very Thin Dark Ring? • Low summer precipitation, coupled with a moderately high amount of summer short wave radiation, creates non-ideal growing conditions causing smaller summer growth rings. Summer Avg= 219.8w/m2
2. Rather Thick Dark Ring? -Increased rainfall during the summer months caused the dark growth ring to be larger than surrounding years.
2. Rather Thick Dark Ring? • Higher summer precipitation, coupled with a moderately high amount of summer short wave radiation, creates more ideal growing conditions allowing for larger summer growth rings. Summer Avg= 215.475w/m2
3. Consistent Decrease in Ring Thickness 3. Consistent decrease in ring thickness How can the Live Access Server be used to show long term trends?
Long Term Trends in the LAS • In the LAS, a user option for output format is an ASCII text file. • This text file can be imported into Excel allowing the user to manipulate the data as needed.
3. Consistent Decrease in Ring Thickness -After importing the rainfall data into Excel, yearly rainfall averages were obtained and plotted. -A line of best fit shows an average decrease in rainfall. -Declining rainfall coupled with increase tree size accounts for the consistent decrease in ring thickness. Rainfall in mm/day mean Year
Short Wave Radiation • The short wave radiation (1983-2006), show a gradual increase in the amount that reaches the Earth’s surface • While there is a gradual increase in surface SW downward flux radiation (used in photosynthesis), the limiting factor in tree ring development at this location was the amount of available water. • A decrease in average rainfall and an increase in average incoming short wave radiation might be leading to non-ideal growing conditions over a long period of time. -Number refer to excel locations. Time shown from Jan 1983 through Jan 2006 (numbers on chart reflect data point numbers)
Earth’s Energy Budget Short Wave Radiation
USGS Real-Time Water Data as a Comparison • Stream data agrees with LAS rainfall data (general decline in available water) http://waterdata.usgs.gov/va/nwis/rt
MY NASA DATA on Climate Change -A section dedicated to Climate change lesson plans that utilize the Live Access Server.
Internet Resources: MY NASA DATA: http://mynasadata.larc.nasa.gov/ MND LAS: http://mynasadata.larc.nasa.gov/data.html How the Earth is Analyzed video: http://www.youtube.com/user/nasascool#p/c/E02ACB77F997C188/4/P4dDF8-kcUI USGS real-time water data: http://waterdata.usgs.gov/nwis/uv?02051000 MY NASA DATA YouTube Channel: http://www.youtube.com/user/MyNASAData Analyzing Tree Rings to Determine Climate Change: http://mynasadata.larc.nasa.gov/preview_lesson.php?&passid=95
SignOffPage Preston M. Lewis Jr. preston.lewis@nasa.gov