Download
1 / 1
10 likes | 176 Vues
2100 UTC. 2100 UTC. a. b. 1800 UTC. 2100 UTC. d. c. 2000 UTC. 2100 UTC. a. b. 2200 UTC. 2300 UTC. a. c. b. c. d. 2000 UTC. 2100 UTC. a. b. 2200 UTC. 2300 UTC. c. d. Science in Operations. Introduction.

E N D
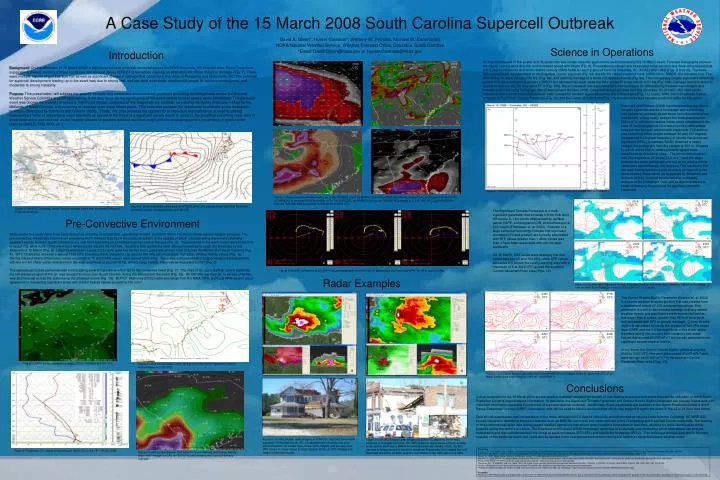
2100 UTC 2100 UTC a b 1800 UTC 2100 UTC d c 2000 UTC 2100 UTC a b 2200 UTC 2300 UTC a c b c d 2000 UTC 2100 UTC a b 2200 UTC 2300 UTC c d Science in Operations Introduction An important aspect of this poster is to illustrate how well certain scientific applications performed during the 15 March event. Forecast hodographs showed the classic veering wind direction and increased speed with height (Fig. 8). Forecasters produced and interpreted cross sections and three-dimensional plots of 0.5 degree reflectivity and storm relative velocity (SRV) fields for each supercell from the Columbia, SC (KCAE) WSR-88D (Figs. 9 and 10). The three-dimensional radar representation of the Edgefield County supercell (Fig. 9a) depicts the classic supercell hook, inflow notch, BWER, and elevated core. The SRV shows Vr shear values of 50 kts. (Fig. 9a), and resulting damage of a home in Edgefield County (Fig. 9b). The Orangeburg County supercell’s reflectivity pattern in three-dimensions illustrates a BWER and elevated hail shaft, while the SRV shows Vr shear values of 53 kts (Fig. 10a). Damage from this storm in downtown Branchville, SC was rated EF-3 (Fig. 10b). Recent research has demonstrated a new technique for differentiating between non-tornadic and tornadic supercells using hodograph data (Esterheld and Guiliano 2008). Observed hodograph data from the Columbia, SC (KCAE) VAD wind profile corroborated the model-indicated low-level “kink” needed for tornadic supercells across the forecast area (Fig. 11). Lastly, NWS Storm Prediction Center analyses of Significant Tornado Parameter (Fig. 12) and the Craven Brooks Index (Fig. 13) also demonstrated valuable predictive utility for this event. Background: On the afternoon of 15 March 2008, a significant tornado outbreak occurred across the NWS Columbia, SC forecast area. Seven long-track supercells spawned numerous minor tornadoes and several strong (EF2-EF3) tornadoes causing an estimated 40 million dollars in damage (Fig. 1). There were multiple reports of golf ball size hail as well as significant structural damage that occurred in the cities of Prosperity and Branchville, SC. The potential for supercell development leading up to the event was due to strong mid- and low-level wind shear coupled with ample lift, surface convergence, and moderate to strong instability. Purpose: This presentation will address the specific synoptic and mesoscale environmental conditions preceding tornadogenesis across the National Weather Service Columbia area of responsibility. It will also touch on the significance of this event related to local severe storm climatology. This particular event was chosen for a variety of reasons. Significant tornado outbreaks of this magnitude are relatively rare during the Spring (February – May) for the Midlands of South Carolina, only occurring on average once every fifteen years. This case also provided the opportunity to evaluate a new hodograph technique developed by Esterheld and Guiliano (2008). Finally, this case provided the opportunity to showcase the importance of viewing gridded mesoanalysis fields of relevant pre-storm elements as related to the threat of a significant severe event. In addition, the benefit of examining radar data in three-dimensions was realized, as the imagery allowed forecasters detailed real-time insight into the developing storm’s morphology of predominant features (BWER, FFD, RFD, etc.). Esterheld and Giuliano (2008) hypothesized that significant tornadic supercells exhibit a hodograph with a prominent kink separating primarily speed shear from directional shear. Additionally, strong nearly straight-line hodographs below 500 m AGL with storm relative inflow winds orthogonal to the base of the hodograph at 10 m were found to differentiate between non-tornadic and tornadic supercells. The authors also noted that inflow angles between 80 and 100 degrees represented the highest frequency of storms that produced significant (EF2+) tornadoes. KCAE observed a nearly straight-line hodograph from the surface to 500 m, followed by a kink above 500 m, where primarily speed shear transitioned to directional shear. The storm motion vector was 240 degrees at 25 knots (12.5 m sˉ¹) and the angle between the lower hodograph and the storm relative inflow vector was approximately 100 degrees. This resulted in the low level hodograph being approximately orthogonal to the storm relative inflow vector as suggested by Esterheld and Giuliano (2008). In future severe weather outbreaks, analysis of the hodograph “kink” will enable forecasters to better understand the potential for significant tornadic supercells. Figure 11: Observed hodograph from Columbia, SC (KCAE) VAD wind profile data at 2025 UTC on 15 March. Figure 7: Operational model data leading up to the 15 March event. (a) NAM12 3 hr forecast 200-300 hPa wind speed (kts) and direction at 2100 UTC. (b) NAM20 3 hr forecast 500 hPa vorticity 10ˉ5sˉ¹ at 2100 UTC. (c) NAM12 0 hr forecast 700-500 hPa omega (µ sˉ¹) at 1800 UTC. (d) NAM12 3 hr forecast 850 hPa wind speed (kts) and direction at 2100 UTC. Figure 2: Surface analysis with background MSLP (hPa) and surface winds (kts) from the Storm Prediction Center’s mesoanalyses at 2100 UTC. Figure 1: NWSFO, Columbia, South Carolina tornado tracks with annotated Enhanced-Fujita scale ratings. The Significant Tornado Parameter is a multi-ingredient parameter that includes 0-6 km bulk wind difference, 0-1 km storm-relative helicity, surface parcel CAPE, surface parcel CIN, and surface parcel LCL height (Thompson et. al. 2004) . Analysis of a large sample of soundings indicate that significant tornadoes (F2 and greater) are typically associated with STP values greater than 1 while values less than 1 have been associated with non-tornadic supercells. On 15 March, CIN values were relatively low and varied between 25 and 100 J/Kg, while STP values exceeded 2-3 across the county warning area with a maximum of 5 at 2200 UTC across the southern Central Savannah River area (Figs. 12). Pre-Convective Environment Data used in this study came from several sources including observed data, operational models, and NWS Storm Prediction Center severe weather products. The pre-convective, mesoscale environment preceding storm initiation featured a low pressure system in the upstate of South Carolina with a warm front extending eastward across northern South Carolina and a cold front extending southwestward across central Georgia (Fig. 2). Temperatures in the warm sector were in the mid to upper 70s, while north of the warm front temperatures were in the mid 60s. Southerly flow across the state allowed dewpoints to reach the lower 60s by the afternoon of 15 March (Fig. 3). Lifted Condensation Levels (LCL) were quite low for this event, generally around 1000 m across the Midlands of South Carolina (Fig. 4). WFO Charleston released a special 1800 UTC sounding which revealed a cap around 800 hPa and moderately high storm relative helicity values (Fig. 5). Storms initiated where Lifted Index values exceeded -6 ºC and CAPE values were around 2000 J/Kg. There was sufficient shear to support supercell development, with the 0-6 km shear vector oriented from the west-southwest at around 70 kts, while Energy Helicity Index values exceeded 5 m²sˉ² (Fig. 6). The operational models performed well in forecasting several ingredients which led to the convective event (Fig. 7). The nose of an upper level jet, and in particular, the left entrance region of the jet, was forecast to move over South Carolina during the afternoon of the event (Fig. 7a). An 850 hPa low level jet, in excess of 40 kts, was also forecast across the state during the afternoon hours (Fig. 7d). BUFKIT (Mahoney 2008) model soundings from the NAM, GFS, and local WRF were in good agreement in forecasting significant shear with 0-6 km helicity values exceeding 700 m²sˉ². Figure 8: BUKFIT (Mahoney 2008) 15 hr forecast hodographs at 2100 UTC 15 March 2008 from (a) Local WRF, (b) GFS, and (c) NAM. Radar Examples Figure 12: The fixed-layer Significant Tornado Parameter (contour) and mixed-layer convective inhibition J/Kg (image) from the NWS Storm Prediction Center for 2000-2300 UTC on 15 March. The Craven Brooks SigSvr Parameter (Craven et. al. 2002) is a severe weather analysis product that was created from a database of nearly 60,000 analyzed soundings. This parameter is used to discriminate between ordinary severe weather events and significant severe events (defined as hail larger than 2 inches, greater than 65 knot wind gusts and tornadoes with EF2 or greater damage). Craven Brooks SigSvr is calculated by taking the product of 100 hPa mixed layer CAPE and the 0-6 km magnitude of the shear vector, therefore taking into account both instability and shear. Values that exceed 20,000 m3 sˉ3 are usually associated with significant severe weather events. In our event, the Craven Brooks SigSvr values during the 2000 to 2300 UTC time period exceeded 30,000 m3sˉ3 and were as high as 55,000 m3 sˉ3 in the southern Central Savannah River area (Figs. 13). A Case Study of the 15 March 2008 South Carolina Supercell Outbreak Figure 3: LAPS surface dewpoint analysis (ºF) for 15 March at 2100 UTC. Figure 4: Lifted Condensation Level (m AGL) from the Storm Prediction Center’s mesoanalyses at 2100 UTC. Figure 13: The Craven Brooks SigSvr parameter from the NWS Storm Prediction Center for 2000-2300 UTC on 15 March (contours are scaled down by 1000, 60 = 60,000 m³sˉ³). Conclusions Critical evaluation of the 15 March 2008 severe weather outbreak revealed the benefit of maintaining situational awareness through the utilization of NWS Storm Prediction Center’s mesoanalyses information. In particular, the Significant Tornado Parameter and Craven Brooks SigSvr parameter can provide forecasters with important information regarding the potential of a severe weather outbreak. Additionally, these parameters are available in the Storm Prediction Center’s Short Range Ensemble Forecast (SREF) information, and can be used to identify environments which may support a significant event in the 12 to 24 hour time frame. Operational examination and interpretation of the three-dimensional 0.5 degree reflectivity and storm relative velocity fields from the Columbia, SC WSR-88D proved valuable in identifying important features such as BWERs, hail cores and mesocyclones in the Orangeburg and Edgefield County supercells. The viewing of three-dimensional radar data during severe weather operations has shown great benefit to forecasters in real-time, allowing for quick identification of key features during the storm’s evolution. The Esterheld and Guiliano (2008) hodograph technique is a relatively new method by which forecasters can analyze hodographs and discriminate between the threat of weak tornadoes (EF0-EF1) and significant tornadoes (EF2+). This technique worked quite well in the post analysis of this particular event, but could also be applied in the operational environment during and before an expected severe weather event. Figure 9: (a) GR2 Analyst radar imagery at 2108 UTC depicting the tornadic supercell in Edgefield county, SC. 0.5 degree base reflectivity and cross section illustrate the classic hook, inflow notch, BWER, and elevated core. SRV shows Vr shear values of 50 kt. (Gibson 2008). (b) EF1 damage of a home in Edgefield county. Figure 10: (a) GR2 Analyst radar imagery at 2325 UTC depicting the tornadic supercell in Orangeburg county, SC. SRV shows Vr shear values of 53 kt. and the cross section illustrates a BWER and elevated hail core (Gibson 2008). (b) EF3 damage to the top level of a two-story downtown Branchville, SC, building that was destroyed due to the tornado, note the inset picture of the triple-layer brick walls. References Craven, J. P., H. E. Brooks, and J. A. Hart, 2002: Baseline climatology of sounding derived parameters associated with deep, moist convection. Preprints, 21st Conf. on Severe Local Storms, San Antonio, Texas, Amer. Met. Soc., 643-646. Esterheld, J. M. and D. J. Guiliano, 2008: Discriminating between tornadic and non-tornadic supercells: A new hodograph technique. Electronic Journal of Severe Storms Meteorology 3 (2), 1 – 50. Gibson, M., 2008: Gibson Ridge Software, GR2Analyst version 1.0. [http://www.grlevelx.com/gr2analyst/] Mahoney, E., 2008: BUFKIT: A forecast profile visualization and analysis tool kit. [Documentation and free download through the NWS / Warning Decision Training Branch at http://www.wdtb.noaa.gov/tools/BUFKIT/index.html] RAOB, 2008: RAOB: The Universal RAwinsonde OBservation program. [http://www.raob.com/user_manual.php] Thompson, R.L., R. Edwards, and C.M. Mead, 2004: An update to the supercell composite and significant tornado parameters. Preprints, 22nd Conf. on Severe Local Storms, Hyannis, MA, Amer. Met. Soc. (CD ROM). *All Storm Prediction Center’s Mesoscale Severe Weather Parameters are available at http://www.spc.noaa.gov/exper/mesoanalysis. **Additional information about the 15 March 2008 event can be found at the NWS Columbia, SC, homepage – http://www.erh.noaa.gov/cae/Events/March152008/March15Severe.php Disclaimer Mention of a commercial company or product does not constitute an endorsement by the National Weather Service. Use of information from this publication concerning proprietary products or tests of such products for publicity or advertising purposes is not authorized. Figure 5: Charleston, SC, upper air sounding at 1800 UTC on the 15th (RAOB 2008). Figure 6: LAPS surface based Lifted Index ºC (black dashed) and Energy Helicity Index m²sˉ² (image) for CAE at 1900 UTC just preceding the supercell tornado outbreak. David A. Glenn*, Hunter Coleman*, Anthony W. Petrolito, Michael W. Cammarata NOAA/National Weather Service, Weather Forecast Office, Columbia, South Carolina *Email: David.Glenn@noaa.gov or Hunter.Coleman@noaa.gov a a b b