Download
1 / 13
140 likes | 255 Vues
Case Study of the May 7, 2002 Tornadic Supercell Outbreak. Kathryn Saussy San Francisco State University Department of Geosciences. 500 mb chart May 7, 2002 12 UTC. Strong WSW winds flow over the Great Plains; a longwave trough approaches Arizona. 500 mb Chart May 8, 2002 00 UTC.

E N D
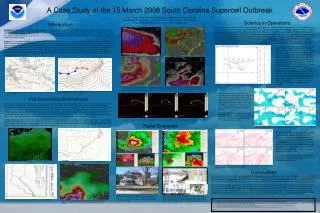
Case Study of the May 7, 2002 Tornadic Supercell Outbreak Kathryn Saussy San Francisco State University Department of Geosciences
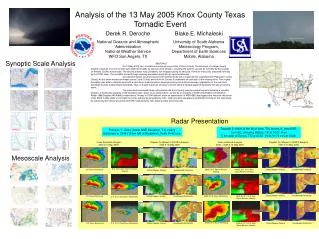
500 mb chartMay 7, 2002 12 UTC Strong WSW winds flow over the Great Plains; a longwave trough approaches Arizona.
500 mb ChartMay 8, 2002 00 UTC Strong SW winds continue to flow over the Great Plains; a trough approaches New Mexico, and pushes closer to the Great Plains region.
Surface AnalysisMay 8, 2002 00 UTC A trough extends over OK; SSE winds, which are nearly perpendicular to the 500 mb flow, are nearly present over OK and KS - which pave the road to excellent storm relative helicity; High dewpoints are in the upper 60s to lower 70s, helping to create the perfect recipe for deep convection: Buoyancy, CAPE, and lifting.
00 UTC Soundings:Topeka, KS and Norman, OK Miller Type I (“loaded gun”); Excellent shear environments (strong differences between 500 mb and surface winds) for conversion streamwise vorticity into rotating updrafts; Storm motions are NE; Anticyclonic loops in both hodographs show large areas of helicity.
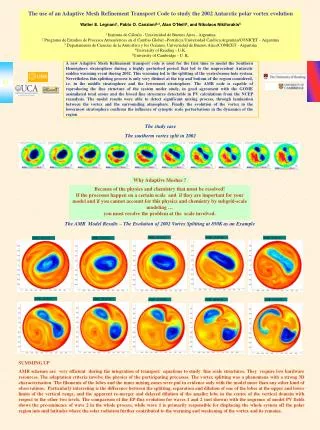
Radar Reflectivity at 2235 UTC Note the fan-shaped echo of the storm as the system moves across Oklahoma.
Radar Reflectivity 2305 UTC A beautiful echo; look for the signature “hook.” Also, the storm is beginning to split. (The fan-shape now looks like a heart.)
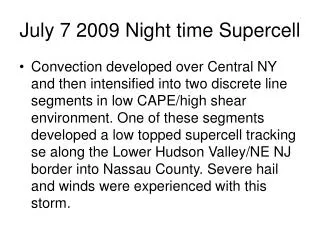
Visible Satellite Images at 2145 and 2315 UTC The explosion of the supercell is clearly evident on both of these visible satellite images. The tornado (seen as a TVS on radar) is also brilliantly clear.