Download
1 / 19
190 likes | 317 Vues
The EnKF Analyses and Forecasts of the 8 May 2003 Oklahoma City Tornadic Supercell Storm. By Nusrat Yussouf 1,2 Edward Mansell 2 , Louis Wicker 2 , Dustan Wheatley 1,2 , David Dowell 3 , Michael Coniglio 2 and David Stensrud 2.

E N D
The EnKF Analyses and Forecasts of the 8 May 2003 Oklahoma City Tornadic Supercell Storm ByNusrat Yussouf1,2 Edward Mansell2, Louis Wicker2 , Dustan Wheatley1,2, David Dowell3, Michael Coniglio2 and David Stensrud2 1. Cooperative Institute for Mesoscale Meteorological Studies, University of Oklahoma, Norman, OK. 2. NOAA/National Severe Storms Laboratory , Norman, OK. 3. NOAA/ESRL/Global Systems Laboratory, Boulder, CO.
Motivation • Most storm-scale NWP modeling studies assume horizontally homogenous environmental conditions • Much easier to obtain a high-quality analysis of supercell storm than a accurate forecast • Stensrud and Gao (2010): Substantial improvement in storm forecast accuracy when using realistic inhomogeneous mesoscale environment • This work focuses on ensemble data assimilation experiments of tornadicsupercell within full mesoscale complexity • In support of Warn on Forecast - a numerical model-based • probabilistic convective-scale analysis and forecast system to • support warning operations within • NOAA A very short-range probabilistic forecasts of tornadicsupercell storms
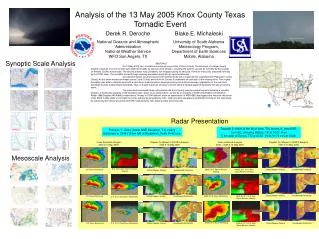
The 8 May 2003 Oklahoma City Tornadic Supercell NWS Damage Path of OKC Tornado Hu and Xue (2007) HPC Synoptic Scale Surface Analyses at 18:00 UTC KOUN Radar Observations at 22:10 UTC
Mesoscale Ensemble • WRF-ARW v3.2.1 • Mesoscale data assimilation on CONUS domain • 18-km horizontal grid spacing; 51 vertical levels • Mean initial and boundary conditions from GFS final analysis • 45 member mesoscale ensemble • IC/BC perturbations from WRF-Var (Torn et al. 2006) • Physics Options: • - Cumulus: Kain-Fritsch - PBL: MYJ • - Microphysics: Thompson - Shortwave Radiation: Dudhia • - LongwaveRadiation:RRTM - Land Surface: Noah • Ensemble Adjusted Kalman Filter (EAKF) approach from the • Data Assimilation Research Testbed (DART)
Mesoscale Data Assimilation • Observations assimilated: • - Altimeter setting (p) - Temperature (T) • - Dewpoint (Td) - Horizontal winds (u and v) • Observation platforms: • - METAR, Radiosonde, Maritime and Automated Aircraft from MADIS • Adaptive prior inflation & localization (1600 obs) • Localization half width: 287/4 km for horizontal/vertical • Filter configuration adapted from Glen Romine’s system at NCAR • Timeline of mesoscale data assimilation experiment: • - Continous cycling for 3 days • - Every 6 hour DA: 18 UTC May 5 – 12 UTC May 8 • - Every 1 hour DA: 13 UTC May 8 - 0 UTC May 9
Storm-Scale Data Assimilation • A 45 member storm-scale ensemble • One-way nested down from mesoscale ensemble analyses at 21Z, May 8 • 2-km horizontal grid spacing , 450 x 360 km wide, 50 vertical levels • KTLX WSR-88D radar doppler velocity (Vr) and reflectivity (dBZ) • Radar data objectively analyzed to 4-km grid using OPAWS • Both adaptive inflation and additive noise to maintain spread • Adaptive localization (2000 obs) • Observation errors: Vr = 2 m s-1, Z = 5 dBZ • Localization half-width: 12/6 km for horizontal/vertical • Timeline of storm-scale data assimilation experiment: • - One hour DA every 3 minutes: • 21 UTC – 22 UTC, May 8 • - One hour ensemble forecast: • 22 UTC - 23 UTC, May 8
Storm-Scale Data Assimilation Experimental Design • Three ensemble DA experiments using different bulk microphysics schemes: • - Thompson 1.5 moment (Thompson et al. 2004, 2008) • Mixing ratio: Qc, Qi, Qs, Qr and Qg • Number Concentrations: ice (Ni) and rain(Nr) • - NSSL Variable Density Double Moment (NVD-DM; Mansell et al. 2010) • Mixing ratio: Qc, Qi, Qs, Qr, Qg and Qh • Number Concentrations: Nc, Nr, Ni, Ns, Ng and Nh • - NSSL Fixed Density Single Moment (NFD-SM; Gilmore et al. 2004) • Mixing ratio: Qc, Qi, Qs, Qr and Qg • Remaining physics options are identical to mesoscale ensemble
Observation-Space Diagnostics: rmsi and total ensemble spread Ensemble spread for reflectivity is consistently smaller than the rmsi Reflectivity rmsi from Thompson is relatively smaller during the later assimilation period Z statistics are calculated where observed Z > 10 dBZ Radial velocity ensemble spread is comparable to rmsi rmsi and spread are similar in magnitude for the 3 microphysics Scheme experiments for Vr Vr statics are calculated at all observed values over the entire domain
Observation-Space Diagnostics: Consistency ratio Reflectivity consistency ratio is well below 1.0 Consistency ratio = (ens. variance + obs-error variance) / (mean-squared innovation)
mesocyclone mesocyclone mesocyclone Analyses at 2200 UTC at 1 km AGL Thompson NFD-SM NVD-DM Member 14 Member 12 Member 31 Vorticity contours from 0.001 to 0.01 at 0.001 s-1 U-V Winds vector (m/s) The areal extent and the reflectivity distribution in the forward flank region is closer to the observation in Thompson and NVD-DM scheme compared to NFD-SM. KTLX Reflectivity Obs.
Reflectivity Forecast at 1 km AGL Thompson NFD-SM NVD-DM KTLX Reflectivity Obs Member 14 Member 12 Member 31 15 min Fcst at 2215 UTC Member 14 Member 12 Member 31 45 min Fcst at 2245 UTC
1-hr Forecast Probability of Vorticity (2145-2245 UTC) after 45-min assimilation Thompson NFD-SM NVD-DM ~22:38 ~22:38 ~22:38 ~22:38 ~22:38 ~22:38 ~22:06 ~22:06 ~22:06 ~22:06 ~22:06 ~22:06 ≥ 0.0015 s-1 at 150m AGL Observed damage track and times Observed damage track and times Observed damage track and times Observed damage track and times Observed damage track and times Observed damage track and times ≥ 0.003 s-1 at 1 km AGL % Probability
45-min Forecast Probability of Vorticity (2200-2245 UTC) after 1-hr assimilation Thompson NFD-SM NVD-DM ~22:38 ~22:38 ~22:38 ~22:38 ~22:38 ~22:38 ~22:06 ~22:06 ~22:06 ~22:06 ~22:06 ~22:06 ≥ 0.0015 s-1 at 150m AGL Observed damage track and times Observed damage track and times Observed damage track and times Observed damage track and times Observed damage track and times Observed damage track and times ≥ 0.003 s-1 at 1 km AGL % Probability
Summary and Future work • The results show promise for short-range, ensemble-based, storm-scale tornadic supercell forecasts initialized from EnKF analyses • The reflectivity structure of the supercell storm using a DM scheme compare better to the observations than that using a SM scheme • Storm-scale ensemble system can predict the track of the strongest rotation with some accuracy in 0-1 hour time frame • Future work: • Vary the microphysical parameters across the ensemble to improve spread • Use of higher resolution grid of 1 km or less
Acknowledgement Glen Romine and Nancy Collins for help with DART Kevin Manross for providing the edited radar data
Reflectivity Analyses at 2200 UTC
Reflectivity Forecasts at 2230 UTC