Download
1 / 67
680 likes | 867 Vues
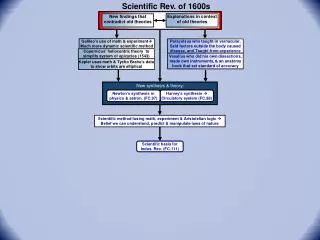
The Scientific Basis for . Newborn Hearing Screening. Number of Hospitals Doing Universal Newborn Hearing Screening. Number of Programs. 3. Status of Universal Newborn Hearing Screening in the United States. . Percentage of Births Screened. . 90%+. 51 - 90%. 21 - 50%. 1 - 20%.

E N D
The Scientific Basis for Newborn Hearing Screening
Number of Hospitals Doing Universal Newborn Hearing Screening Number of Programs
3 Status of Universal Newborn Hearing Screening in the United States . Percentage of Births Screened . 90%+ 51 - 90% 21 - 50% 1 - 20%
Newborn Hearing Screening Prior to 1990 Conventional ABR 2 Too expensive !
Newborn Hearing Screening Prior to 1990 Conventional ABR 2 Too expensive ! High-Risk Indicators 2 50% of children with congenital hearing losses do ! not exhibit any high-risk indicators Only about 1/2 of those who have a high-risk ! indicator make an appointment for further testing and only 1/2 of those are ever tested
How Many Hearing Impaired* Children were at High Risk as Infants? 49 % Feinmesser et al. (1982) 54 % Pappas & Schaibly (1984) % 48 Elssmann et al. (1987) 43 % Watkin et al. (1991) % 50 Mauk et al. (1991) 0 50 100 * Limited to children with permanent bilateral hearing loss > 50 dB
Newborn Hearing Screening Prior to 1990 Conventional ABR 2 Too expensive ! High-Risk Indicators 2 50% of children with congenital hearing losses do not exhibit any ! high-risk indicators Only about 1/2 of those who have a high-risk indicator make an ! appointment for further testing and only 1/2 of those are ever tested Home-Based Behavioral Screening 2 Programs Requires very expensive infrastructure ! Not as successful as widely believed !
Percentage of Children with Permanent Hearing Loss Identified by the Infant Distraction Test Performed at 8 Months of Age Archives of Disease in Childhood, 65, 846-850. 50 40 30 20 10 0 Severe/Profound Mild/Moderate Bilateral Bilateral Unilateral (n = 39) (n = 72) (n = 60) Watkin, P. M., Baldwin, M., & Laoide, S. (1990). Parental suspicion and identification of hearing impairment.
Newborn Hearing Screening 1990-1993 Healthy People 2000 Goals , Effectiveness of Automated ABR demonstrated , RIHAP and others demonstrate the effectiveness of , TEOAE-based universal newborn hearing screening NIH Consensus Conference in March 1993 ,
NIH Consensus Panel Early Identification of Hearing Impairment in Infants and Young Children March, 1993 The consensus panel concluded that all infants should be screened for hearing impairment...this will be accomplished most efficiently by screening prior to discharge from the well-baby nursery. Infants who fail ... should have a comprehensive hearing evaluation no later than 6 months of age.
NIH Recommended Screening Protocol OAE Screening Prior ABR Comprehensive Hearing Evaluation Before 6 Months of Age to Hospital Screening Fail Fail Discharge
Statements Endorsing Early Detection of Hearing Loss The Department of Education, in collaboration with the Department of Health and Human Services, should issue federal guidelines to assist states in implementing improved [hearing] screening procedures for each live birth. Commission on Education of the Deaf, 1988 Reduce the average age at which children with significant hearing impairment are identified to no more than 12 months. Healthy People 2000 Report, 1990 All hearing impaired infants should be identified and treatment initiated by 6 months of age. In order to achieve this ... the consensus panel recommends screening of all newborns ... for hearing impairment prior to hospital discharge. NIH Consensus Statement, 1993 The 1994 [JCIH] Position Statement endorses the goal of universal detection of infants with hearing loss ... [and] recommends the option of evaluating infants before discharge from the newborn nursery. Joint Committee on Infant Hearing, 1994 Universal detection of infant hearing loss requires universal screening of all infants. American Academy of Pediatrics, 1998
Implementing Universal Newborn Hearing Screening Programs out Then a miracle occurs Start Good work, but I think we might need just a little more detail right here.
Issues to be Considered In Deciding Whether Universal Newborn Hearing Screening Should Be the Method of Choice in Detecting Hearing Loss? I. Prevalence of Congenital Hearing Loss II. Consequences of Neonatal Hearing Loss III. Effects of Earlier Versus Later Identification and Intervention IV. Accuracy of Newborn Hearing Screening Methods V. Efficiency of Existing Early Detection Programs VI. Costs of Newborn Hearing Screening VII. Has Hospital-based Hearing Screening Become the Standard of Care?
Reported Prevalence Rates of Bilateral Permanent Childhood Hearing Loss (PCHL) in Population-based Studies 4.0 3.5 12 3.0 2.5 8 Prevalence per 1,000 9 2.0 3 4 1.5 5 7 2 1.0 11 10 .5 1 6 0 20 25 30 35 40 45 50 55 60 65 dB Threshold Level (loss criterion) 1. Barr (1980), n = 65,000 7. Parving (1985), n = 82,265 2. Downs (1978), n = 10,726 8. Sehlin et al. (1990), n = 63,463 3. Feinmesser et al. (1986), n = 62,000 9. Sorri & Rantakallio (1985), n = 11,780 4. Fitzland (1985), n = 30,890 10. Davis & Wood (1992), n = 29,317 5. Kankkunen (1982), n = 31,280 11. Fortnum et al. (1996), n = 552,558 6. Martin (1982), n = 4,126,268 12. Watkin et al. (1990), n = 51,250
Percentage of Sensorineural Hearing Losses Which Are Unilateral # of Hearing Impaired Author (year) Children in Sample % Unilateral 1307 48% Kinney (1953) 1829 37% Brookhauser, Worthington & Kelly (1991) 171 35% Watkin, Baldwin, & Laoide (1990)
II. Consequences of Neonatal Hearing Loss Severe/Profound PCHL Losses 2 Mild Bilateral and Unilateral PCHL Losses 2 Fluctuating Conductive Loss 2
Reading Comprehension Scores of Hearing and Deaf Students 10.0 ' Deaf 9.0 , ' Hearing ' 8.0 ' 7.0 ' 6.0 ' Grade Equivalents 5.0 ' 4.0 ' 3.0 ' , , , , , , , 2.0 , , , , 1.0 8 9 10 11 12 13 14 15 16 17 18 Age in Years Schildroth, A.N., & Karchmer, M.A. (1986). Deaf children in America . San Diego: College Hill Press.
Effects of Unilateral Hearing Loss Normal Hearing Unilateral Hearing Loss Math Keller & Bundy (1980) (n = 26; age = 12 yrs) Language Math Peterson (1981) (n = 48; age = 7.5 yrs) Language Social Bess & Thorpe (1984) (n = 50; age = 10 yrs) Math Blair, Peterson & Viehweg (1985) Language (n = 16; age = 7.5 yrs) Math Culbertson & Gilbert (1986) Language (n = 50; age = 10 yrs) Social Average Results 0th 10th 20th 30th 40th 50th 60th Math = 30th percentile Percentile Rank Language = 25th percentile Social = 32nd percentile
Effects of Mild Fluctuating Conductive Hearing Loss Teele, et al., 1990 194 children followed prospectively from 0-7 years. ) Days child had otitis media between 0-3 years assessed during normal visits to physician. ) Data on intellectual ability, school achievement, and language competency individually ) measured at 7 years by "blind" diagnosticians. Results for children with less than 30 days OME were compared to children with more than ) 130 days adjusted for confounding variables. Effect Size for Outcome Measure Less vs. More OME WISC-R Full Scale .62 Metropolitan Achievement Test Math .48 Reading .37 Goldman Fristoe Articulation .43 Teele, D.W., Klein, J.O., Chase, C., Menyuk, P., Rosner, B.A., and the Greater Boston Otitis media Study Group (1990). Otitis media in infancy and intellectual ability, school achievement, speech, and language at age 7 years. The Journal of Infectious Diseases , 162 , 685-694.
III. Effects of Earlier Versus Later Identification and Intervention Prospective randomized trials have not been done. 2 Most existing evidence is weakened by: 2 potential for selection bias. ) lack of long-term follow-up to assess "wash-out" effect. ) small sample sizes. ) subjective assessments of outcomes. )
Yoshinaga-Itano, et al., 1996 Compared language abilities of hearing-impaired children identified 6 before 6 months of age (n = 46) with similar children identified after 6 months of age (n = 63). All children had bilateral hearing loss ranging from mild to profound, 6 and normally-hearing parents. Language abilities measured by parent report using the Minnesota 6 Child Development Inventory (expressive and comprehension scales) and the MacArthur Communicative Developmental Inventories (vocabulary). Cross-sectional assessment with children categorized in 4 different 6 age groups. Yoshinaga-Itano, C., Sedey, A., Apuzzo, M., Carey, A., Day, D., & Coulter, D. (July 1996). The effect of early identification on the development of deaf and hard-of-hearing infants and toddlers . Paper presented at the Joint Committee on Infant Hearing Meeting, Austin, TX.
Expressive Language Scores for Hearing Impaired Children Identified Before and After 6 Months of Age 35 30 25 Language Age in Months 20 15 10 Identified BEFORE 6 Months 5 Identified AFTER 6 Months 0 13-18 mos 19-24 mos 25-30 mos 31-36 mos (n = 15/8) (n = 12/16) (n = 11/20) (n = 8/19) Chronological Age in Months
Vocabulary Size for Hearing Impaired Children Identified Before and After 6 Months of Age 300 250 200 Vocabulary Size 150 100 Identified BEFORE 6 Months 50 Identified AFTER 6 Months 0 13-18 mos 19-24 mos 25-30 mos 31-36 mos (n = 15/8) (n = 12/16) (n = 11/20) (n = 8/19) Chronological Age in Months
Watkins, 1987 Comparisons made among 3 groups of bilaterally hearing-impaired 6 children (n = 23 in each group) Group #1: Received average of 9 months home intervention before 30 months age, followed by preschool intervention. Group #2: Attended preschool beginning at an average of 36 months. Group #3: Received no home intervention and no preschool intervention. Children matched on hearing severity (PTA ~ 85 dBHL), presence of 6 other handicaps, and analysis of covariance used to adjust for age at post test, age of mother, SES, and number of childhood middle ear infections. Data collected by uninformed, trained examiners when children were 10 6 years old. Watkins, S. (1987). Long term effects of home intervention with hearing-impaired children. American Annals of the Deaf , 132 , 267-271. Watkins, S. (1983). Final Report: 1982-83 work scope of the Early Intervention Research Institute , Logan, Utah: Utah State University.
Effects of Earlier Intervention (Watkins, 1989) Read Math Vocabulary No EI or Preschool Articulation Preschool Childrens Developmental Outcomes Is Understood EI<9 mos +Preschool Understands Social Behavior 0 20 40 60 80 100 Percentile Scores
Boys Town National Research Hospital Study of Earlier vs. Later 129 deaf and hard-of-hearing children assessed 2x each year. ) Assessments done by trained diagnostician as normal part of early intervention program. ) 6 Identified <6 mos (n = 25) 5 Identified >6 mos (n = 104) 4 3 Language Age (yrs) 2 1 0 0.8 1.2 1.8 2.2 2.8 3.2 3.8 4.2 4.8 Age (yrs) Moeller, M.P. (1997). Personal communication , moeller@boystown.org
IV. Accuracy of Newborn Hearing Screening Methods How many children with hearing loss are identified? , How many children with hearing loss are missed? ,
Sensitivity of Various UNHS Techniques Although various rates of sensitivity are reported, there are ) no studies of UNHS with sufficient sample sizes to definitively establish sensitivity for any of the techniques. Weakness with existing studies of "sensitivity" ) Small sample sizes. 2 One screening technique compared to another screening 2 technique (e.g., OAE vs. ABR). All screening passes are not followed. 2 Samples include only high-risk babies. 2
Accuracy of ABR for Newborn Hearing Screening Hyde, Riko, and Malizia (1990) 713 at-risk infants screened with ABR prior to hospital discharge. ) Children evaluated by "blind" examiners at mean of 3.9 years of age (range 3-8years). ) Results based on 1367 ears with reliable ABR and pure tone thresholds. ) Hearing Status Hearing Status Impaired Normal Normal Impaired 125 57 44 45 Refer Refer ABR Screen ABR Screen (40 (30 dBHL) dBHL) 1197 0 1265 1 Pass Pass Sensitivity = 100% Sensitivity = 98% Specificity = 91% Specificity = 96% Hyde, M.L., Riko, K., & Malizia, K. (1990). Audiometric accuracy of the click ABR in infants at risk for hearing loss. J Am Acad Audio l, 1 , 59-66.
Accuracy of ABR for UNHS Saint Barnabus Medical Center, NJ 15,749 infants born from 1/1/93 to 12/31/95 screened with Nicolet Compass ) ABR system without sedation. Normal care nursery babies screened at 35 dB HL; NICU and High Risk ) screened at 40 dB HL and 70 dB HL. Screening done by audiologists, usually within 24 hours of birth. ) Babies with a High Risk Indicator who passed initial screen were ) re-evaluated at 6 months. # and % # and % PCHL # and Births Screened Referred Prevalence 16,229 15.749 485 52 (97%) (3.1%) 3.3/1000 Barsky-Firkser, L., & Sun, S. (1997). Universal newborn hearing screenings: A three year experience. Pediatrics , 99 (6), 1-5.
What Percentage of Hearing Impaired Children were High Risk as Infants? 49% Feinmesser et al. (1982) 54% Pappas & Schaibly (1984) 48% Elssmann et al. (1987) 43% Watkin et al. (1991) 50% Mauk et al. (1991) 50% Mehl & Thomson (1998) 0% 50% 100%
Accuracy of High Risk Based UNHS Programs Mahoney and Eichwald (1987) Program operational from 1978-1995. 2 JCIH indicators incorporated into legally required birth certificate. 2 Computerized mailing and follow-up, and free diagnostic assessments at regional 2 offices and/or mobile van. Program now discontinued because: 2 parents only made appointments for about 1/2 the children who had a risk ) indicator. only about 1/2 of the children with an appointment showed up. ) of difficulty obtaining accurate information from hospitals for some risk ) indicators. Mahoney, T.M., & Eichwald, J.G. (1987). The ups and "downs" of high-risk hearing screening: The Utah statewide program. Seminars in Hearing , 8 (2), 155-163.
Results of Birth Certificate Based High Risk Registry to Identify Hearing Loss in Utah (1978-1984) Births, 283,298 Live Births with High Risk Indicators 24,082 (8.5%) No Response Parent Response 11,383 (47.3%) 12,699 (52.7%) Appointments for No Concern 5,254 (41.4%) Diagnostic Evaluation 7,445 (58.6%) Diagnostic Evaluation Broken Completed Appointments 5,644 (75.8%) 1,801 (24.2%) Summary: 23.4% of live births with high-risk indicators completed a diagnostic evaluation; .36 SNHL per 1000 identified. Mahoney, T.M., & Eichwald, J.G. (1987). The ups and "downs" of high-risk hearing screening: The Utah statewide program. Seminars in Hearing , 8 (2), 155-163.
Accuracy of Home-Based Behavioral Screening Watkin, Baldwin and Laoide, 1990* Retrospective analysis of 171 hearing impaired children to determine how ) they were identified. Hearing loss first noticed by: ) Home visitor or Other than Parent School Screening Parent (e.g., teacher, doctor, etc.) 18 10 11 Severe/profound (46%) (26%) (28%) Bilateral (n = 39) 51 14 7 Mild/Moderate (71%) (19%) (10%) Bilateral (n = 72) 34 18 8 Unilateral (57%) (30%) (13%) *Parental suspicion and identification of hearing impairment. Archives of Disease in Childhood, 65, 846-850.
Percentage of Hearing Impaired Children in Watkin, et al. (1990) Identified by Home Screening at 7-9 Months of Age 50 40 30 20 10 0 Severe/Profound Mild/Moderate Bilateral Bilateral Unilateral (n = 39) (n = 72) (n = 60)
Accuracy of OAE-Based Newborn Hearing Screening Plinkert et al. (1990) Sample: 95 ears of high-risk infants Comparison: TEOAE vs. ABR ( > 30 dB) @ mean age = 9 weeks) Results: TEOAE compared to ABR: sensitivity = 90%; specificity = 91% Plinkert, P.K., Sesterhenn, G., Arold, R., & Zenner, H.P. (1990). Evaluation of otoacoustic emissions in high-risk infants by using an easy and rapid objective auditory screening method. European Archives of Otorhinolaryngology , 247 , 356-360.
Kennedy et al. (1991) Sample: 370 infants (223 NICU, 61 normal nursery with risk factors, and 86 normal lnursery with no risk factors Comparison: TEOAE, ABR ( > 35 dB), and Automated ABR ( > 35 dB) all at 1 month vs. behaviorally confirmed hearing loss, mean age = 8 months Results: TEOAE identified same 3 infants with sensorineural hearing loss as ABR and automated ABR Kennedy, C.R., Kimm, L., Dees, D.C., Evans, P.I.P., Hunter, M., Lenton, S., & Thornton, R.D. (1991). Otoacoustic emissions and auditory brainstem responses in the newborn. Archives of Disease in Childhood , 66 , 1124-1129.
Rhode Island Hearing Assessment Project (RIHAP) 1850 infants (normal and special care) screened prior to hospital discharge with TEOAE and ABR ) Referrals for either TEOAE or ABR were rescreened at 3-6 weeks and referred for diagnosis as ) necessary Fail TEOAE Fail ABR NICU High-Risk Failed test, Present in NICU, Risk Factor Present Passed Test, Not in NICU, Risk Factors Absent White, K.R., & Behrens, T.R. (Editors) (1993). The Rhode island Hearing Assessment Project: Implications for universal newborn hearing screening. Seminars in Hearing , 14 (1).
Accuracy of TEOAE 2-Stage Screen* Sensorineural Loss Hearing Status Impaired Normal 11 79 Refer RIHAP Screen 1643 0 Pass "Sensitivity" = 100% "Specificity" = 95% *Note: Analysis is based on heads. Infants initially screened but lost to follow-up or rescreen because of parent refusal, lost contact, or repeated broken appointments (> 3) are not included. White, K.R., Vohr, B.R., Maxon, A.B., Behrens, T.R., McPherson, M.G., & Mauk, G.W. (1994). Screening all newborns for hearing loss using transient evoked otoacoustic emissions. International Journal of Pediatric Otorhinolaryngology , 29 , 203-217.
Accuracy of Automated ABR Jacobson, Jacobson, & Spahr Hall, Kileny, Ruth, & Kripal (1987) (1990) (447 ears) (336 ears) Conventional ABR Conventional ABR Refer Pass Pass Refer 11 18 17 33 Refer Refer ALGO I ALGO I 397 307 0 0 Pass Pass Sensitivity = 100% Sensitivity = 100% Specificity = 96% Specificity = 97%
Accuracy of Automated ABR (continued) Hermann et al. (1995) Von Wedel, Schauseil-Zipf and (304 ears) Doring (1988) (100 ears) Conventional ABR Conventional ABR Refer Pass Pass Refer 8 4 6 42 Refer Refer ALGO I ALGO I 256 0 86 2 Pass Pass Sensitivity = 98% Sensitivity = 80% Specificity = 100% Specificity = 96%
Accuracy of Automated ABR Summary of 4 Studies (1187 ears) Conventional ABR Pass Refer 101 38 Refer ALGO I 1046 2 Pass Sensitivity = 96% Specificity = 98% Herrmann, B.S., Thornton, A.R., & Joseph, J.M. (1995). Automated infant hearing screening using the ABR: Development and validation. American Journal of Audiology , 4 (2), 6-14.
NIH Study: Identification of Neonatal Hearing Impairment Multi-Center Study Based at University of Washington Null Hypothesis: ABR, TEOAE, and DPOAE are equally effective for newborn hearing 2 screening. 7178 infants (4510 NICU and 2668 normal nursery) screened prior to discharge with 2 ABR, TEOAE, and DPOAE in random order. Screening results will be compared with ear specific VRA at 8-12 months.* 2 Other issues investigated: 2 Influence of co-existing medical factors on characteristics of OAE and ABR. ! Optimum stimulus and recording parameters for OAE. ! Time and cost-efficiency of ABR and OAE. ! Influence of external and middle ear status, test environment, and tester ! characteristics. Data collection completed October, 1997; data expected to be reported April 1998.
V. Efficiency of Existing UNHS Programs Coverage and Referral Rates 2 Effects on Parents 2 Follow-up 2
Births Per Year, Percent of Babies Screened, and Reported Referral Rates of Universal Newborn Hearing Screening Programs Percent Babies Reported Pass Average Births Screened Before Rate at # of Per year Discharge Discharge Hospitals a 64 2140 94.9 91.6% OAE-Based Programs b 56 1348 96.2 96.0% ABR-Based Programs 120 1767 95.5 93.7% All Programs a 55 of 64 OAE-based programs were TEOAE, 9 were DPOAE b 54 of 56 ABR-based programs were automated ABR White, K.R., Mauk, G.W., Culpepper, N. B., & Weirather, Y. (1997). Newborn hearing screening in the United States: Is it becoming the standard of care? In L. Spivak (Ed.), Neonatal hearing screening . Thieme: New York.
Possible Adverse Effects for Parents of Various Hearing Screening Results False-Positive ) Adversely affect parent-child bonding (e.g., rejection or over-protection). 2 Anger, resentment, or confusion when child is confirmed normal. 2 Lingering concerns about whether child's hearing is normal. 2 False Negative ) Inappropriate confidence that child hears normally, thus delaying 2 identification. True Positive ) Emotional stress during time of emerging parent-child relationship. 2 Incomplete or inaccurate information may be used to make future 2 reproductive decisions. Adapted from Clayton, E.W. (1992). Screening and treatment of newborns. Houston Law Review , 29 (1), 85-148.