Download
1 / 31
320 likes | 556 Vues
Analysis of high-throughput assays. Gregoire Pau, EMBL Heidelberg gregoire.pau@embl.de. European Molecular Biology Laboratory. cellHTS2. Analysis of high-throughput screens with univariate readout Generation of quality reports and scored phenotype lists. Configuration. Screenlog.

E N D
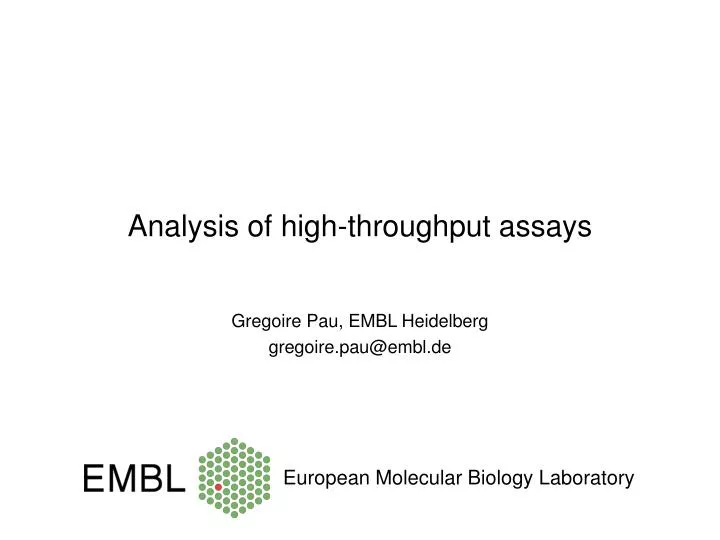
Analysis of high-throughput assays Gregoire Pau, EMBL Heidelberg gregoire.pau@embl.de European Molecular Biology Laboratory
cellHTS2 • Analysis of high-throughput screens with univariate readout • Generation of quality reports and scored phenotype lists Configuration Screenlog Annotation
Limitations • CellHTS2 cannot analyse high-content assays Actin Tubulin DNA siRluc siSH2B2 siELMO2
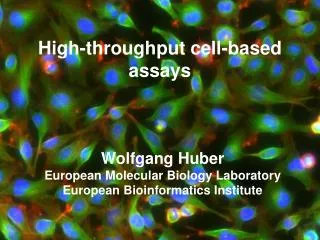
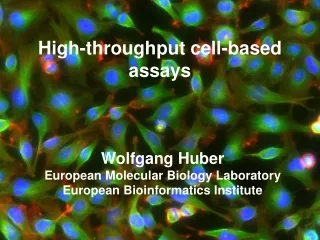
imageHTS • Modular R/Bionconductor software to analyse high-content assays • Features • Quantification of cell phenotypes • Generation of web interfaces to inspect/query data and annotate cells • Extension of cellHTS2 • Support of large-scale processing • Generic, flexible and light • Currently available on Bioconductor
An imageHTS workflow Features extraction Imaging Segmentation Source image source Calibrated image cal Segmentation mask seg n g.x g.y g.s g.p g.pdm [1,] 123.1391 3.288660 194 67 9.241719 [2,] 206.7460 9.442248 961 153 20.513190 [3,] 502.9589 7.616438 219 60 8.286918 [4,] 20.1919 22.358418 1568 157 22.219461 [5,] 344.7959 45.501992 2259 233 35.158966 [6,] 188.2611 50.451863 2711 249 28.732680 [7,] 269.7996 46.404036 2131 180 26.419631 [8,] 106.6127 58.364243 1348 143 21.662879 [9,] 218.5582 77.299007 1913 215 25.724580 [10,] 19.1766 81.840147 1908 209 26.303760 [11,] 6.3558 62.017647 340 68 10.314127 [12,] 58.9873 86.034128 2139 214 27.463158 [13,] 245.1087 94.387405 1048 123 18.280901 [14,] 411.2741 109.198678 2572 225 28.660816 [15,] 167.8151 107.966014 1942 160 24.671533 [16,] 281.7084 121.609892 2871 209 31.577270 n n n n g.x g.y g.s g.p g.pd 123.1391 3.288660 194 67 9.241719 n n n n n Summary Classification n n n n n d n n n n n n Objects labels clabels Object features ftrs Phenotypic profile profile
imageHTS/cellHTS2 integration • Multichannel preliminary support
New features in cellHTS2 • Custom reporting
The Mitocheck screen • Genome-wide siRNA time-lapse screen in live HeLa cells • Enumeration of essential factors in cell division • Cells imaged for 48 h, t = 30 min, ~22800 genes, 3 siRNAs, 3 replicates siINCENP Segregation defect siScrambled Wild type siKIF11 Prometaphase arrest Neumann, Walter et al., Nature 2010
Nucleus labelling Interphase Mitotic Polynucleated Apoptotic
Nucleus labelling siScrambled Wild type siKIF11 Mitotic arrest
Dynamic model of population averages • ODE model • Transition rates • Modeling the phenotypic effect • Intensity i • Time of appearance i
Model fitting • 13 unknown parameters: • Penalized least squares regression, minimizing: • Levenberg-Marquardt minimization + positive constraint on • Penalty term to improve the robustness of the estimation • 64 different initial conditions, sampled from previously fitted data • Fitted model parameters = phenotypic profile RSS Penalty
Fitted data 1 1 siScrambled Wild type siScrambled Wild type 2 siCOPB1 Cell death siKIF11 Mitotic arrest
Fitting error as a quality metric • Measure of discrepancy between fitted data and the model
Dynamic phenotypes siDDX39 Early cell death 2= 28.4 h siPRPF8 Late cell death 2= 41.4 h
Cell death Wild type Mitotic arrest
Example script ## initialize imageHTS object localPath = 'screens/kimorph' serverURL = 'http://www.ebi.ac.uk/~gpau/imageHTS/screens/kimorph' x = parseImageConf('conf/imageconf.txt', localPath=localPath, serverURL=serverURL) x = configure(x, 'conf/description.txt', 'conf/plateconf.txt', 'conf/screenlog.txt') x = annotate(x, 'conf/annotation.txt') ## get wells unames = getUnames(x) ## segment and extract features segmentWells(x, unames, 'conf/segmentationpar.txt') extractFeatures(x, unames, 'conf/featurepar.txt') ## classification readLearnTS(x, 'conf/featurepar.txt', 'conf/trainingset.txt') predictCellLabels(x, unames) ## summarize features summarizeWells(x, unames, 'conf/featurepar.txt') ## install web modules installWebQuery(x) ## get data ftrs = readHTS(x, 'ftrs', plate=12, well='C07', sample='dmso') profiles = readHTS(x, 'profiles')
Configuration AssayName: ypmp SourceFilenamePattern: source/{plate}-{replicate}/--W000{wellid}--P00{spot}--Z00--T00--{channel}.tif PlateNames: 001, 002, 003, 004, 005, 006, 007, 008, 009, 010, 011 ReplicateNames: 01, 02, 03, 04, 05, 06, 07 WellIdDirection: Row RowNames: A, B, C, D, E, F, G, H ColNames: 01, 02, 03, 04, 05, 06, 07, 08, 09, 10, 11, 12 SpotNames: 01, 02, 03, 04, 05, 06, 07, 08, 09 ChannelNames: BF, GFP 2000, GFP 500
Flexible segmentation scheme seg.method: segmentYeast gain.bf: 100 gain.gfp: 160 threshold.bf: 0.05 max.membrane.thickness: 11 crown.thickness: 16 crown.steps: 61, 121, 4 thumbnail.crop: 1, 1344, 1, 1024 thumbnail.resize.width: 300 segmentYeast segmentATH
Segmentation Actin Tubulin DNA • Adaptive thresholding on DNA • Voronoi tessellation • Using a tubulin gradient metric DNA
Cell quantification cell size cell intensity eccentricity nucleus size DNA content actin content tubulin content actin F11 actin F12 actin F21 actin F22 tubulin F11 tubulin F12 … 289 34.33118 0.472934 2857.356 485.2710 0.828876 0.098647 0.049594 0.081746 0.158817 0.179339 0.009249 0.219697 … 178 features per cell
Cell labelling Actin Fiber n n af n n n n n Big Cell n n n n n n p n n n n n n n Debris n n n n n n n bc n af n n n c n n n n n Lamellipodia af n c n n bc n n n n n n n n n n Metaphase n bc n n n n n n n n n n n n n m n c n Normal 178 features per cell Radial-kernel SVM Manually annotated training set of ~3000 cells Accuracy: ~ 90 % Protusions
Screen quality metrics Fuchs, Pau et al., Molecular Systems Biology 2010
siELMO2 siSH2B2 siCLSPN Fuchs, Pau et al., Molecular Systems Biology 2010 siNUF2
Flexible high-content processing framework Seeding GFP-tagged library ~ 700 membrane proteins ~20 conditions Microscopy-based screening