Download
1 / 37
390 likes | 618 Vues
High-throughput cell-based assays. Wolfgang Huber European Molecular Biology Laboratory European Bioinformatics Institute. Signaling pathways. Pictures from N. Silverman UMass. Drosophila antibacterial signalling pathway. Drosophila Toll/antifungal signaling pathway.

E N D
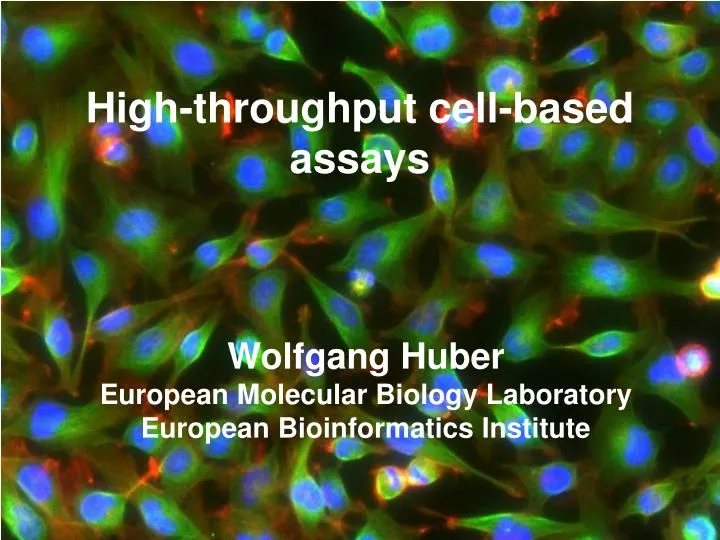
High-throughput cell-based assays Wolfgang Huber European Molecular Biology Laboratory European Bioinformatics Institute
Signaling pathways Pictures from N. Silverman UMass Drosophila antibacterial signalling pathway Drosophila Toll/antifungalsignaling pathway
Interference/Perturbation tools Small compounds Full-length cDNA (over-)expression RNAi
RNAi Initiation Execution He and Hannon, 2004
RNAi as a loss of function perturbator degradation protein gene-sequence specific reagents (eg siRNAs) easy to make for any gene (there are caveats...) translation mRNA transcription gene living cells
RNAi as a loss of function perturbator degradation protein gene-sequence specific reagents (eg siRNAs) easy to make for any gene (there are caveats...) mRNA transcription gene living cells
RNAi as a loss of function perturbator gene-sequence specific reagents (eg siRNAs) easy to make for any gene (there are caveats...) mRNA transcription gene living cells
C. elegans Drosophila Mammals E. coli dsRNA dsRNA siRNA T7 > 200bp > 200bp 21bp Injection and soaking Bathing Transfection Feeding bacteria Cell-culture Cell-culture Worms Precursor dsRNA Dicer siRNAs Degradation of target message RNAi experiments in different organisms
siRNAs for RNAi in mammals Identification by Elbashir et al., 2001 • Size is critical • siRNA (21-22nt) mediate mammalian RNAi • Introducing siRNA instead of dsRNA prevents non-specific effects Application via transient transfection • No persistent or propagative effect as in C. elegans • Can be chemically synthesized or generated by in vitro transcription
Automated liquid handling Sterile housing Transfection reagents Buffers & antibodies Chamber slides Expression plasmids Transfection mixing plate Christian Schmitt
What is a phenotype: it all depends on the assay Any cellular process can be probed. - (de-)activation of a signaling pathway - cell differentiation - changes in the cell cycle dynamics - morphological changes - activation of apoptosis Similarly, for organisms (e.g. fly embryos, worms) Phenotypes can be registered at various levels of detail - yes/no alternative - single quantitative variable - tuple of quantitative variables - image - time course
Monitoring tools for automated phenotyping Plate reader 96 or 384 well plates, 1…4 measurements per well FACS ca. 2000 x 4…8 measurements per well Automated Microscopy practically unlimited. many MB
Homogenous Platereader Assays Cells are seeded on-top of pre-aliquoted siRNA pools RNAi by reverse-transfection 2x 68 384-well plates +/- Compound treatment (48h pt) 72h Cell viability (‘CellTiterGlo’ Assay) Computational analysis Secondary assays
Automated Microscope ('high content screening') - Cube - Urban Liebel EMBL
Genomewide Morphology Screen By Florian Fuchs & Michael Boutros, DKFZ HD HeLa cells Reverse transfection with Dharmacon library 21,500 siRNA pools (4 siRNAs each) End-point assay - after 48h stain 3 channels: Actin (TRITC) Tubulin (Alexa 488) DNA (Hoechst) BD Pathway, 4 sites per well, two replicate scans 172,000 images à 1 MegaPixel, 12 bit
Segmentation of nuclei and cell boundariesExtraction of ~200 quantitative features per cellClustering and classification of millions of per-cell phenotypes by 'machine learning'Cell phenotype profile for each of 21,500 siRNA-poolsIdentification of per-gene phenotypes by classification and statistical testing EBImage
EBImage Image processing and analysis on large sets of images in a programmatic fashion A package of R functions - to construct workflows that integrate statistic analysis and quality assessment, using a "real" modern language Number crunching uses C (easy to add your own C/C++ modules) Based on ImageMagick and other C/C++ image processing libraries Free and open source (LGPL), distributed with Bioconductor Collaboration with Michael Boutros, Florian Fuchs (DKFZ) thresholding original image opening/closing distance map cells detected detected nuclei & cells
An iterative algorithm for fully automatic cell segmentation • Find nuclear envelopes in DNA channel • Filter “bad” nuclear envelopes • Find cell areas given nuclear envelopes, on Tubulin and Actin channels • Filter “bad” cells • Iterate until convergence Oleg Sklyar, Greg Pau
Finding nuclear envelopes: local adaptive threshold segmentation
Accurate demarkation of each cell's cytoplasm area • Compute a binary mask: presence or not of (tubulin actinDNA) • Boundaries between cells by Voronoi tesselation Cytoplasm mask Nuclear mask Cytoplasm boundary
Voronoi segmentation on image manifold partition a metric space with n seed sets into n convex polygons such that • each polygon contains exactly one seed • every point in a polygon is closer to its seed than to any other • Seed sets: nuclei • Space: Cytoplasmic mask • Metric: dr T. Jones, A. Carpenter et al.: CellProfiler Euclidian limit=105 Gradient limit =10-5
Object features number of objects Generic Moments: area, mass (=intensity), center of mass, elements of the covariance matrix and its eigenvalues, rotation angle, Hu's 7 rotation invariants Haralick texture features Zernike rotation invariant moments Application-adapted measures of acircularity or relative overlap between different stain channels
Zernike Moments • |n|<=m, m-|n| even • |Amn| rotation invariant • careful: f a discrete image, pixelisation of the circle
From object features to phenotypes per-cell object features classification (descriptors) summary statistics per-gene feature set per cell phenoytpe classification (descriptors) classification (class occupancies) per gene phenotype
Thumbnail overview of one plate's images Gallery view of segmented objects of one well
Long term drifts Number of cells Number of cells / no. cells in negative controls in same plate
o phenotype A o missing
Phenotype of interest: elongated cells 67 / F13 GPR124 Homo Sapiens probable G protein-coupled receptor 124 precursor (tumor endothelial marker 5) Number of cells Run 1: 357 / NC:473.5Run 2: 357 / NC:474 Wilcoxon test for acirc:p= 0, W= 1078176 Z-test acirc:p= 4.9e-105, t= 24.5806 01 / A08 AZU1 Homo Sapiens azurocidin precursor (cationic antimicrobial protein CAP37), heparin-binding protein) (HBP) Number of cells: Run 1: 302 / NC:308Run 2: 312 / NC:305 Wilcoxon test for acirc:p=1.11022e-16, W= 465024 Z-test acirc:p=1.87601e-17, t= 8.5637 54/ F13 FLJ41238 Homo sapiens family with sequence similarity 79, member B (FAM79B), mRNA Number of cells: Run 1: 281 / NC:417.5Run 2: 274 / NC:432.5 Wilcoxon test for acirc:p=0.990294, W= 440619 Z-test acirc:p=0.994775, t=-2.56542
Phenotype of interest: elongated cells 67 / F13 GPR124 Homo Sapiens probable G protein-coupled receptor 124 precursor (tumor endothelial marker 5) Number of cells Run 1: 357 / NC:473.5Run 2: 357 / NC:474 Wilcoxon test for acirc:p= 0, W= 1078176 Z-test acirc:p= 4.9e-105, t= 24.5806 01 / A08 AZU1 Homo Sapiens azurocidin precursor (cationic antimicrobial protein CAP37), heparin-binding protein) (HBP) Number of cells: Run 1: 302 / NC:308Run 2: 312 / NC:305 Wilcoxon test for acirc:p=1.11022e-16, W= 465024 Z-test acirc:p=1.87601e-17, t= 8.5637 54/ F13 FLJ41238 Homo sapiens family with sequence similarity 79, member B (FAM79B), mRNA Number of cells: Run 1: 281 / NC:417.5Run 2: 274 / NC:432.5 Wilcoxon test for acirc:p=0.990294, W= 440619 Z-test acirc:p=0.994775, t=-2.56542 Wilcox: Wilcoxon rank sum test with continuity correction. One sided with alternative hypothesis: shift > 0 Z-test: Two-sample Welch t-test. One sided with alternative hypothesis of diff(means) > 0 Gene info obtained from ensembl using biomaRt
Reproducibility construction of a complete, always re-runnable workflow: raw data results Visualization for pattern detection, hypothesis generation and Quality Assessment Drill down audit trail, verification of the automated analysis result Software engineering more than "hacking" Versioning Software deployment and distribution Considerations for automated data analysis
Acknowledgements EBI Ligia Bras Oleg Sklyar DKFZ Thomas Horn Sandra Steinbrink Florian Fuchs Dierk Ingelfinger Michael Boutros Stefan Wiemann EMBL Jan Ellenberg Thomas Walter Beate Neumann Urban Liebel FHCRC Seattle Florian Hahne Robert Gentleman