Download
1 / 1
10 likes | 129 Vues
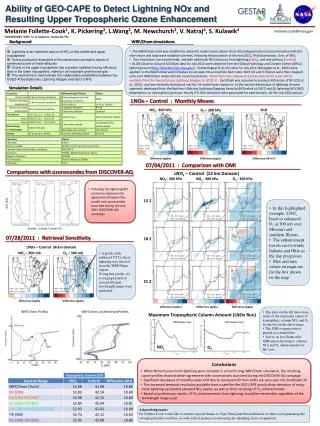
LNOx run. LNOx_SingleSourceRemoved. Influence of Lightning-produced NOx on upper tropospheric ozone ------Using TES/O3&CO, OMI/NO2&HCHO in CMAQ modeling study M. J. Newchurch 1 , A. P. Biazar 1 , L Wang 1 , K. Chance 2 , T. P. Kurosu 2 , W. J. Koshak 3 , R. V. Martin 4

E N D
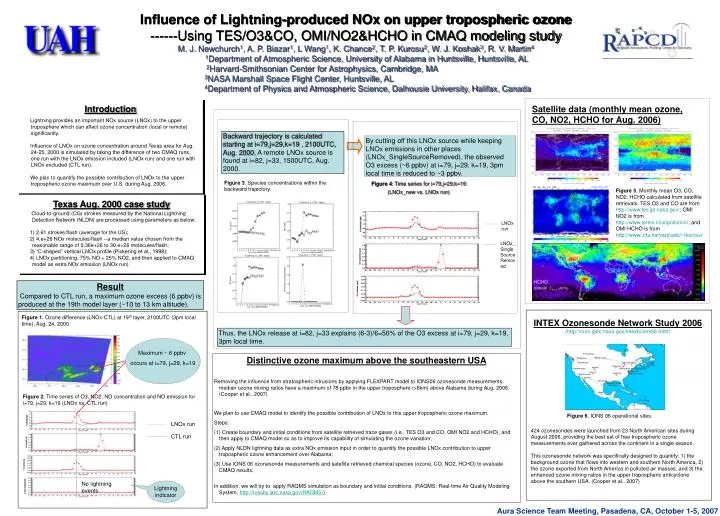
LNOx run LNOx_SingleSourceRemoved Influence of Lightning-produced NOx on upper tropospheric ozone ------Using TES/O3&CO, OMI/NO2&HCHO in CMAQ modeling study M. J. Newchurch1, A. P. Biazar1, L Wang1, K. Chance2, T. P. Kurosu2, W. J. Koshak3, R. V. Martin4 1Department of Atmospheric Science, University of Alabama in Huntsville, Huntsville, AL 2Harvard-Smithsonian Center for Astrophysics, Cambridge, MA 3NASA Marshall Space Flight Center, Huntsville, AL 4Department of Physics and Atmospheric Science, Dalhousie University, Halifax, Canada Introduction Lightning provides an important NOx source (LNOx) to the upper troposphere which can affect ozone concentration (local or remote) significantly. Influence of LNOx on ozone concentration around Texas area for Aug. 24-25, 2000 is simulated by taking the difference of two CMAQ runs, one run with the LNOx emission included (LNOx run) and one run with LNOx excluded (CTL run). We plan to quantify the possible contribution of LNOx to the upper tropospheric ozone maximum over U.S. during Aug. 2006. Satellite data (monthly mean ozone, CO, NO2, HCHO for Aug. 2006) Backward trajectory is calculated starting at i=79,j=29,k=19 , 2100UTC, Aug. 2000. A remote LNOx source is found at i=82, j=33, 1500UTC, Aug. 2000. By cutting off this LNOx source while keeping LNOx emissions in other places (LNOx_SingleSourceRemoved), the observed O3 excess (~6 ppbv) at i=79, j=29, k=19, 3pm local time is reduced to ~3 ppbv. Figure 3. Species concentrations within the backward trajectory. Figure 4: Time series for i=79,j=29,k=19 (LNOx_new vs. LNOx run) Figure 5. Monthly mean O3, CO, NO2, HCHO calculated from satellite retrievals. TES O3 and CO are from http://www.tes.jpl.nasa.gov/;OMI NO2 is from http://www.temis.nl/airpollution/; and OMI HCHO is from http://www..cfa.harvard.edu/~tkurosu/ Texas Aug. 2000 case study Cloud-to-ground (CG) strokes measured by the National Lightning Detection Network (NLDN) are processed using parameters as below: 1) 2.61 strokes/flash (average for the US); 2) 4.e+26 NOx molecules/flash --a median value chosen from the reasonable range of 0.36e+26 to 30.e+26 molecules/flash; 3) “C-shaped” vertical LNOx profile (Pickering et al., 1998); 4) LNOx partitioning: 75% NO + 25% NO2, and then applied to CMAQ model as extra NOx emission (LNOx run). Result Compared to CTL run, a maximum ozone excess (6 ppbv) is produced at the 19th model layer (~10 to 13 km altitude). Figure 1. Ozone difference (LNOx-CTL) at 19th layer, 2100UTC (3pm local time), Aug. 24, 2000 INTEX Ozonesonde Network Study 2006 (http://croc.gsfc.nasa.gov/intexb/ions06.html) Thus, the LNOx release at i=82, j=33 explains (6-3)/6=50% of the O3 excess at i=79, j=29, k=19, 3pm local time. Maximum ~ 6 ppbv occurs at i=79, j=29, k=19 Distinctive ozone maximum above the southeastern USA Removing the influence from stratospheric intrusions by applying FLEXPART model to IONS06 ozonesonde measurements, median ozone mixing ratios have a maximum of 78 ppbv in the upper troposphere (>6km) above Alabama during Aug. 2006. (Cooper et al., 2007) We plan to use CMAQ model to identify the possible contribution of LNOx to this upper tropospheric ozone maximum. Steps: (1) Create boundary and initial conditions from satellite retrieved trace gases (i.e., TES O3 and CO, OMI NO2 and HCHO), and then apply to CMAQ model so as to improve its capability of simulating the ozone variation; (2) Apply NLDN lightning data as extra NOx emission input in order to quantify the possible LNOx contribution to upper tropospheric ozone enhancement over Alabama; (3) Use IONS 06 ozonesonde measurements and satellite retrieved chemical species (ozone, CO, NO2, HCHO) to evaluate CMAQ results. In addition, we will try to apply RAQMS simulation as boundary and initial conditions. (RAQMS: Real-time Air Quality Modeling System, http://rossby.larc.nasa.gov/RAQMS/) Figure 2. Time series of O3, NO2, NO concentration and NO emission for i=79, j=29, k=19 (LNOx vs. CTL run) Figure 6. IONS 06 operational sites. LNOx run 424 ozonesondes were launched from 23North American sites during August 2006, providing the best set of free tropospheric ozone measurements ever gathered across the continent in a single season. This ozonesonde network was specifically designed to quantify: 1) the background ozone that flows into western and southern North America, 2) the ozone exported from North America in polluted air masses, and 3) the enhanced ozone mixing ratios in the upper tropospheric anticyclone above the southern USA. (Cooper et al., 2007) CTL run No lightning events Lightning indicator Aura Science Team Meeting, Pasadena, CA, October 1-5, 2007