Download
1 / 23
240 likes | 421 Vues
Estimating Link Travel Time with Explicitly Considering Vehicle Delay at Intersections Aichong Sun Email: asun@pagnet.org Tel: (520) 792-1093. Current Status of VDF in Travel Demand Model VDF Estimation VDF Validation VDF Implementation Conclusions. Content Outline. Link-Based VDFs

E N D
Estimating Link Travel Time with Explicitly Considering Vehicle Delay at Intersections Aichong Sun Email:asun@pagnet.org Tel: (520) 792-1093
Current Status of VDF in Travel Demand Model VDF Estimation VDF Validation VDF Implementation Conclusions Content Outline
Link-Based VDFs • The Bureau of Public Roads (BPR) Function Current Status of VDF in Travel Demand Model • Conical Volume-Delay Function Could change Free-Flow-Travel-Time and Capacity are typically determined by link-class/area-type lookup table without considering the intersecting streets Stay same Get built or upgraded
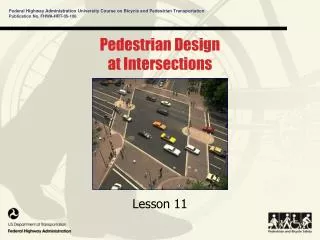
VDF Considering Intersection Delay • Logit-based Volume Delay Function Israel Institute of Transportation Planning & Research • HCM Intersection Delay Function • Other functions (good discussion on TMIP 3/6/08-3/17/08) Current Status of VDF in Travel Demand Model • Common Issues • over-sophisticated with the intension of thoroughly characterizing traffic dynamics Computational Burden & Data Requirement • Function are not convex in nature No convergence for traffic assignment procedure
PAG’s Travel Demand Model • Use only BPR functions until very recently • BPR functions are not calibrated with local data • Travel demand model is not calibrated against travel speed/time • Traffic is not routed appropriately • Overestimate average travel speed Current Status of VDF in Travel Demand Model
Study Design - Foundamental Thoughts • The VDF should be: • Well Behaved – reaction to the changes of travel demand, traffic controls and cross-streets • Simple – computation time • Convex – model convergence • Least Data Demanding - implementation VDF Estimation Data Collected must cover whole range of congestion
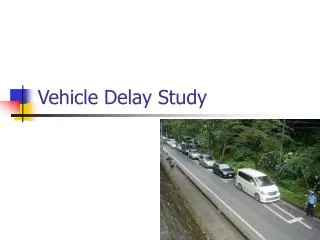
Study Design – Data Collection Method • Floating-Car method with portable GPS devices • Two major arterial corridors were selected VDF Estimation Data collected from Broadway Blvd to estimate the model; data collected from Ina Rd to validate the model • Survey Duration 3 weekdays (Mar. 3 – 6, 2008), 12 hours a day (6:00AM – 6:00PM)
Collected Data • GPS 1(2)-Sec Vehicle Location Data VDF Estimation
Collected Data • Distance between signalized intersections • Posted speed limits • Lane Configuration for each street segment between intersections • 15-min interval traffic counts between major intersections Collected concurrently at 7 locations on Broadway Blvd and 3 locations on Ina Rd • Signal phasing/timing/coordination information Collected from jurisdictions VDF Estimation
VDF Model Form Signal Delay (NCHRP 387) BPR function VDF Estimation - Percentage of through traffic Adjustment based on congestion - Traffic Progression Adjustment Factor - Coefficients - Segment capacity - Intersection Approach Capacity for through traffic - signal g/c ratio for through traffic - midblock free-flow travel time, NCHRP 387 - Signal Cycle Length
Nature of the function form • Convex (when Beta’s >= 1) VDF Estimation Convex Convex Convex • Sensitive to Signal Timing & Congestion Midblock congestion Intersection congestion g/c ratio
Parameters • Capacity • Mid-block • - HCM approach • - (Linkclass, AreaType) lookup Table • Intersection • - Saturation rate 1800/1900 vehicle/hr/lane (HCM) • - Signal g/c ratio VDF Estimation • Speed • NCHRP Report 387 Or
Parameters • Through Traffic Percentage (70%-90%) • Traffic Progression Adjustment Factor • - HCM 2000 (0 – 2.256) • - NCHRP Report 387 VDF Estimation
Model Estimation – Prepare Dataset • Identify the floating car locations and arrival times immediately after the intersections to compute travel time and travel distance for each run • Build the dataset with one record for each pair of identified travel distance and travel time between two neighboring intersections • Append the following data to each record in the dataset • Traffic Counts • Street Segment Capacity • Free-Flow-Speed • Signal Cycle Length • Signal g/c Ratio • Signal Traffic Progression Adjustment Factor • Intersection Saturation Rate VDF Estimation
Model Estimation – Regression • Nonlinear regression • Often no global optimum… • Regression Methods • - Enumeration Method (Least Square) • Specify range & increment for each parameter • Enumerate the combinations of possible values for each parameter • Compute MSE for each combination of parameter values • Save 50 combinations of the parameter values that result in the least MSE • - Statistical Analysis Software (SPSS, SAS) • Verify the parameters estimated from Enumeration Method • Report statistical significance for estimated parameters VDF Estimation
Model Estimation – Results • Enumeration Method VDF Estimation
Model Estimation – Results • Statistical Analysis Software (SPSS & SAS) Parameter Estimates R2 = 0.38 VDF Estimation • Both Methods reported very similar parameter estimates
Ina Rd Data Apply the parameters estimated from Broadway Blvd data to Ina Rd VDF Validation
Average Regional Travel Speed BPR – FFS from NCHRP Report 387 VDF Validation BPR – FFS from PAG Model Speed Lookup Table New VDF – FFS from NCHRP Report 387
Travel Times of Individual Routes VDF Validation N W E N NE
New VDF is made with C codes and compiled as the modeling software DLL • OUE Assignment is used to replace standard UE assignment for faster convergence • FAQs • Q: Posted Speed Limits for future year network • A: Use the average of the present similar facilities in terms of link class and area type • Q: Cycle Length, g/c Ratio, Progression Adjustment Factor for future year network • A: Categorize the intersection in terms of the facility type of intersecting streets, area type and so on VDF Implementation
Empirical Model • Provide some insights into the traffic dynamics, but not as much as HCM traffic flow/congestion models • Report more precise vehicle travel time/speed • Reasonably sensitive to intersection configuration Turning traffic may experience further delay that is not captured by the VDF • Further study with more samples is necessary (in plan) • Other function forms should be investigated Conclusions
Questions, Comments Or Suggestions? Aichong Sun Email:asun@pagnet.org Kosok Chae Email: kchae@pagnet.org Tel: (520) 792-1093