Download
1 / 1
10 likes | 175 Vues
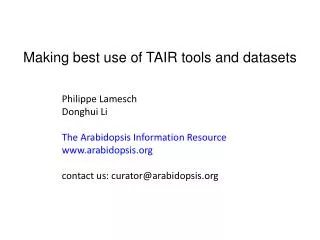
Obese and normal-weight children display a different plasma metabolic profile as measured with 1 H-NMR spectroscopy Bervoets Liene 1,2,3 , Massa Guy 2 , Reekmans Gunter 3 and Adriaensens Peter 3 1 Faculty of Medicine and Life Sciences, Hasselt University, Hasselt, Belgium

E N D
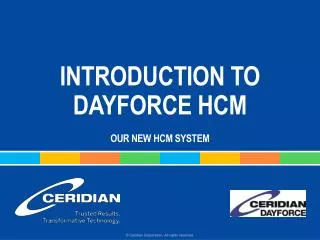
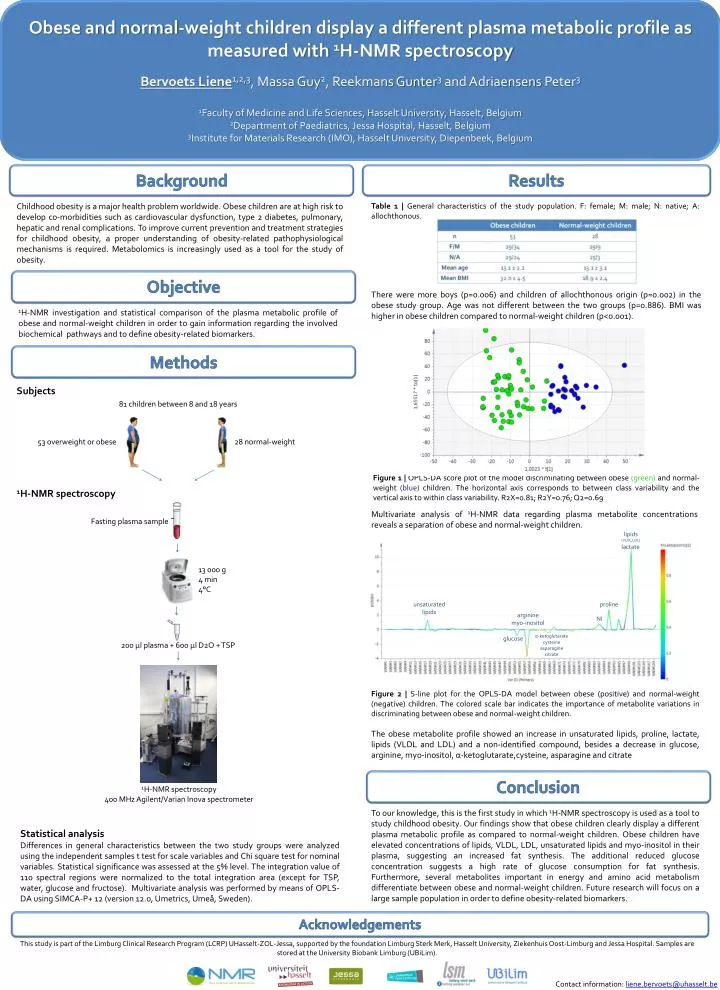
Obese and normal-weight children display a different plasma metabolic profile as measured with 1H-NMR spectroscopy Bervoets Liene1,2,3, Massa Guy2, Reekmans Gunter3 and Adriaensens Peter3 1Faculty of Medicine and Life Sciences, Hasselt University, Hasselt, Belgium 2Department of Paediatrics, Jessa Hospital, Hasselt, Belgium 3Institute for Materials Research (IMO), Hasselt University, Diepenbeek, Belgium Background Results Childhood obesity is a major health problem worldwide. Obese children are at high risk to develop co-morbidities such as cardiovascular dysfunction, type 2 diabetes, pulmonary, hepatic and renal complications. To improve current prevention and treatment strategies for childhood obesity, a proper understanding of obesity-related pathophysiological mechanisms is required. Metabolomics is increasingly used as a tool for the study of obesity. Table 1 | General characteristics of the study population. F: female; M: male; N: native; A: allochthonous. Objective There were more boys (p=0.006) and children of allochthonous origin (p=0.002) in the obese study group. Age was not different between the two groups (p=0.886). BMI was higher in obese children compared to normal-weight children (p<0.001). 1H-NMR investigation and statistical comparison of the plasma metabolic profile of obese and normal-weight children in order to gain information regarding the involved biochemical pathways and to define obesity-related biomarkers. Methods Subjects Fasting plasma sample 81 children between 8 and 18 years 53 overweight or obese 28 normal-weight Figure 1 | OPLS-DA score plot of the model discriminating between obese (green) and normal-weight (blue) children. The horizontal axis corresponds to between class variability and the vertical axis to within class variability. R2X=0.81; R2Y=0.76; Q2=0.69 1H-NMR spectroscopy Multivariate analysis of 1H-NMR data regarding plasma metabolite concentrations reveals a separation of obese and normal-weight children. lipids (VLDL,LDL) lactate 13 000 g 4 min 4°C unsaturated lipids proline arginine myo-inositol NI α-ketoglutarate cysteine asparagine citrate glucose 200 µl plasma + 600 µl D2O + TSP Figure 2 | S-line plot for the OPLS-DA model between obese (positive) and normal-weight (negative) children. The colored scale bar indicates the importance of metabolite variations in discriminating between obese and normal-weight children. The obese metabolite profile showed an increase in unsaturated lipids, proline, lactate, lipids (VLDL and LDL) and a non-identified compound, besides a decrease in glucose, arginine, myo-inositol, α-ketoglutarate,cysteine, asparagine and citrate Conclusion 1H-NMR spectroscopy 400 MHzAgilent/Varian Inova spectrometer To our knowledge, this is the first study in which 1H-NMR spectroscopy is used as a tool to study childhood obesity. Our findings show that obese children clearly display a different plasma metabolic profile as compared to normal-weight children. Obese children have elevated concentrations of lipids, VLDL, LDL, unsaturated lipids and myo-inositol in their plasma, suggesting an increased fat synthesis. The additional reduced glucose concentration suggests a high rate of glucose consumption for fat synthesis. Furthermore, several metabolites important in energy and amino acid metabolism differentiate between obese and normal-weight children. Future research will focus on a large sample population in order to define obesity-related biomarkers. Statistical analysis Differences in general characteristics between the two study groups were analyzed using the independent samples t test for scale variables and Chi square test for nominal variables. Statistical significance was assessed at the 5% level. The integration value of 110 spectral regions were normalized to the total integration area (except for TSP, water, glucose and fructose). Multivariate analysis was performed by means of OPLS-DA using SIMCA-P+ 12 (version 12.0, Umetrics, Umeå, Sweden). Acknowledgements This study is part of the Limburg Clinical Research Program (LCRP) UHasselt-ZOL-Jessa, supported by the foundation Limburg Sterk Merk, Hasselt University, Ziekenhuis Oost-Limburg and Jessa Hospital. Samples are stored at the University Biobank Limburg (UBiLim). • Contact information: liene.bervoets@uhasselt.be