Download
1 / 27
300 likes | 758 Vues
One Sample Z-test. Convert raw scores to z-scores to test hypotheses about sample Using z-scores allows us to match z with a probability Calculate: z = (statistic – parameter)/standard error of statistic = (sample mean – population mean)/standard error of mean

E N D
One Sample Z-test • Convert raw scores to z-scores to test hypotheses about sample • Using z-scores allows us to match z with a probability • Calculate: z = (statistic – parameter)/standard error of statistic = (sample mean – population mean)/standard error of mean where standard error of mean = s/sqrt(n)
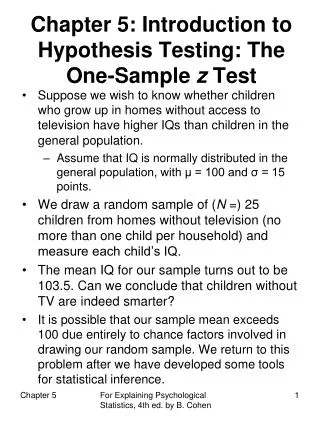
One Sample Z-test • If the calculated Z falls outside of the “likely” zone of our distribution, we reject the null hypothesis. • The area in the distribution that falls outside of the “likely” zone is called the “region of rejection” and is formally calleda --- or the probability of making a Type 1 error • Typically a is set at .05
a a
Types of alternative hypotheses • Non-directional – “there is a difference” • Also called “two-tailed” • Directional – “there is a difference that is directional” • Also called “one-tailed” • Students in CPS have a different average GRE score than OSU graduate students in general • Students in CPS have a higher average GRE score than OSU graduate students in general
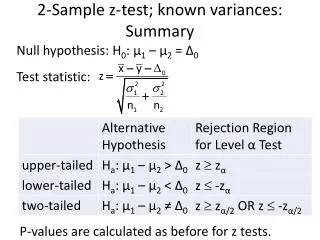
Types of alternative hypotheses • Students in CPS have a different average GRE score than OSU graduate students in general • H0: m=average OSU GRE • H1:m average OSU GRE • Students in CPS have a higher average GRE score than OSU graduate students in general • H0: m=average OSU GRE • H1:m > average OSU GRE
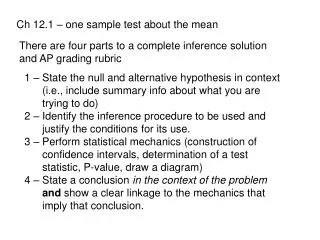
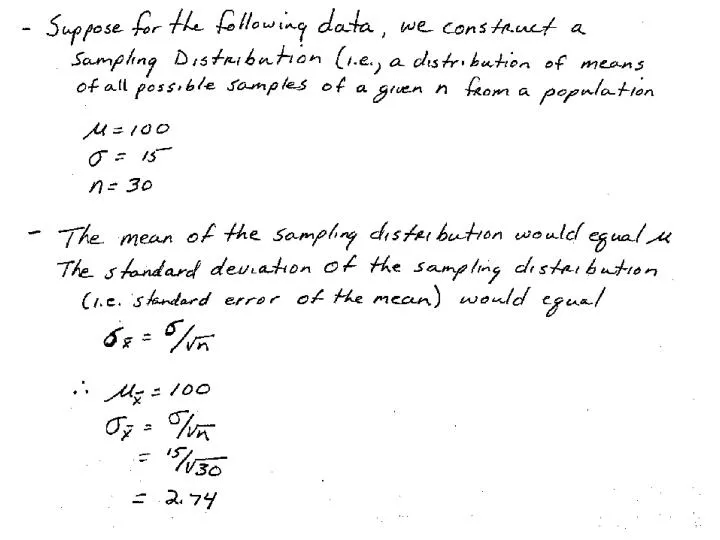
Two tailed hypothesis • If we take a sample of 30 students and find their average IQ to be 106.58, we can test whether the population from which our sample came had an average IQ of 100 H0: m=100 (average IQ) H1:m≠ 100 • Convert our sample mean to Z statistic (106.58-100)/2.74 = 2.4
Z= 2.4 Z=-2.4
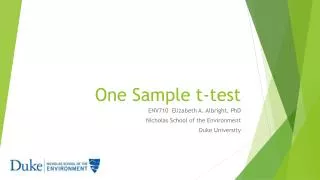
One tailed hypothesis • If we take a sample of 30 students and find their average IQ to be 106.58, we can test whether the population from which our sample came had an average IQ greater than 100 H0: m=100 (average IQ) H1:m> 100 • Convert our sample mean to Z statistic (106.58-100)/2.74 = 2.4
One tailed hypothesis • If we take a sample of 30 students and find their average IQ to be 93.42, we can test whether the population from which our sample came had an average IQ less than 100 H0: m=100 (average IQ) H1:m< 100 • Convert our sample mean to Z statistic (93.42-100)/2.74 = - 2.4
Steps of Hypothesis Testing • State Hypothesis • Set Criterion for Rejection H0 • Compute Test Statistic and Probability • Make Decision
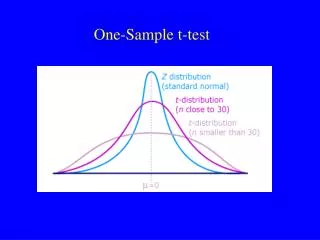
One-Sample T-test • If we do not know the s of the population – we can’t calculate the SE of the mean • We can estimate it with the SD of the sample: SEmean=s/sqrt(n) • Instead of calculating z statistic – we calculate the t-statistic t = (statistic – parameter)/standard error of statistic = (sample mean – population mean)/standard error of mean where standard error of mean = s/sqrt(n)
One-Sample T-test • After calculating t-statistic, we find associated p-value • SPSS does this for us • T is about the same as Z in large samples. • For this class we will always use T
Making a decision • We compare the calculated p-value to our preset a level • If p< a, reject null hypothesis • If p> a, fail toreject null hypothesis
1-sample t-test • As sample size increases, the results from a t-test approximate a z-test • SPSS only does one sample t-tests