Download
1 / 11
130 likes | 365 Vues
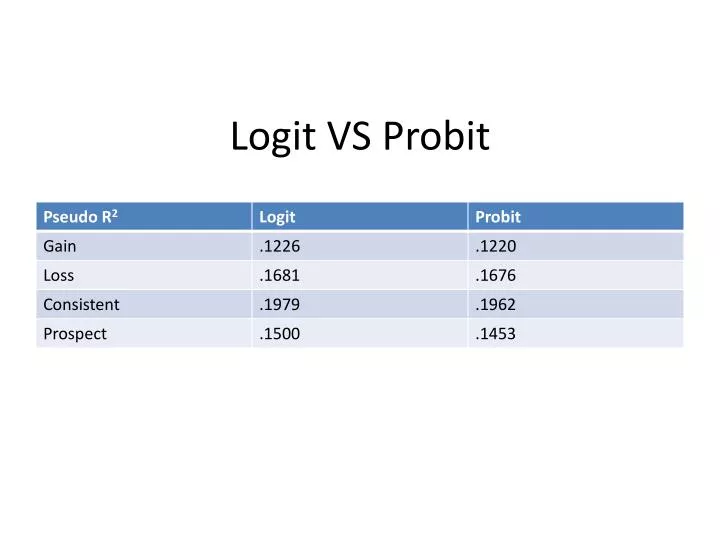
Logit VS Probit. Multicollinearity. Variable | VIF 1/VIF -------------+---------------------- cgpa | 3.51 0.284876 exec | 2.22 0.449574 coe | 2.17 0.459895 cla | 2.11 0.474160 usg | 1.87 0.533809

E N D
Multicollinearity Variable | VIF 1/VIF -------------+---------------------- cgpa | 3.51 0.284876 exec | 2.22 0.449574 coe | 2.17 0.459895 cla | 2.11 0.474160 usg | 1.87 0.533809 fail | 1.85 0.539904 cob | 1.81 0.552524 cso | 1.75 0.570504 spo | 1.70 0.587795 ccs | 1.63 0.615103 sociocivic | 1.51 0.661154 artist | 1.43 0.697746 do | 1.43 0.697836 ced | 1.40 0.715838 single | 1.33 0.752037 male | 1.31 0.764595 athlete | 1.28 0.780571 cos | 1.23 0.814467 year | 1.21 0.826796 -------------+---------------------- Mean VIF | 1.72
Heteroscedasticity Breusch-Pagan / Cook-Weisberg test for heteroskedasticity Ho: Constant variance Variables: fitted values of gain chi2(1) = 0.27 Prob > chi2 = 0.6032
Marginal effects after logit y = Pr(gain) (predict) = .58551842 ------------------------------------------------------------------------------ variable | dy/dx Std. Err. z P>|z| [ 95% C.I. ] X ---------+-------------------------------------------------------------------- exec | -.0654206 .06939 -0.94 0.346 -.20143 .070588 .663043 fail | -.0125505 .02833 -0.44 0.658 -.068074 .042973 1.6087 athlete*| -.0111731 .38205 -0.03 0.977 -.759977 .737631 .032609 artist*| .1061354 .16788 0.63 0.527 -.222898 .435168 .152174 usg*| .1607951 .1645 0.98 0.328 -.161619 .48321 .271739 cso*| .2084456 .14428 1.44 0.149 -.074336 .491227 .25 spo*| .3129035 .20194 1.55 0.121 -.082896 .708703 .021739 socioc~c*| .1205887 .33378 0.36 0.718 -.533604 .774781 .032609 ccs*| .2582453 .17009 1.52 0.129 -.075117 .591608 .097826 ced*| .369431 .11821 3.13 0.002 .137751 .601111 .065217 cla*| -.0753862 .2571 -0.29 0.769 -.579289 .428517 .097826 cob*| .1196579 .15158 0.79 0.430 -.177435 .416751 .315217 coe*| -.3140313 .19924 -1.58 0.115 -.70454 .076477 .184783 cgpa | -.5219233 .25709 -2.03 0.042 -1.02582 -.018028 2.72109 male*| .0685172 .1258 0.54 0.586 -.178045 .31508 .532609 single*| .3996482 .13683 2.92 0.003 .131471 .667826 .782609 year | .0354592 .08156 0.43 0.664 -.124393 .195312 2.83696 ------------------------------------------------------------------------------ (*) dy/dx is for discrete change of dummy variable from 0 to 1
Interpretation(Gain) • The probability that Y=1 is 59% • People are generally risk averse • Students who hold executive positions are more likely to be risk seeking • Students who join extracurricular activities are more likely to be risk averse, except for athletes • As students fail more, they tend to be more risk seeking • Those with high CGPA are more likely to be risk seeking • Male are more likely to be risk averse • Those who are single are more likely to be risk averse • As years goes by, students tend to be more risk averse.
Marginal effects after logit • y = Pr(loss) (predict) • = .40368042 • ------------------------------------------------------------------------------ • variable | dy/dx Std. Err. z P>|z| [ 95% C.I. ] X • ---------+-------------------------------------------------------------------- • exec | .0721286 .07194 1.00 0.316 -.068869 .213126 .588889 • fail | .0446001 .03126 1.43 0.154 -.016662 .105862 1.56667 • athlete*| .0675779 .41021 0.16 0.869 -.736417 .871573 .033333 • artist*| -.0293145 .19107 -0.15 0.878 -.40381 .345181 .144444 • usg*| -.261394 .15213 -1.72 0.086 -.559567 .036779 .266667 • cso*| .169309 .17225 0.98 0.326 -.1683 .506918 .255556 • socioc~c*| .1046709 .46328 0.23 0.821 -.803333 1.01267 .033333 • ccs*| .2786843 .2468 1.13 0.259 -.205038 .762406 .088889 • ced*| -.2613246 .17545 -1.49 0.136 -.605196 .082546 .066667 • cla*| -.2950811 .18929 -1.56 0.119 -.666088 .075926 .088889 • cob*| -.0499317 .15545 -0.32 0.748 -.354611 .254747 .322222 • coe*| -.0171185 .21815 -0.08 0.937 -.444676 .410439 .188889 • cgpa | .2807113 .25879 1.08 0.278 -.226512 .787934 2.71217 • male*| -.1737314 .12486 -1.39 0.164 -.418451 .070988 .544444 • single*| -.1791192 .15745 -1.14 0.255 -.487717 .129479 .788889 • year | .0295779 .08082 0.37 0.714 -.128832 .187988 2.83333 • ------------------------------------------------------------------------------ • (*) dy/dx is for discrete change of dummy variable from 0 to 1
Interpretation(Loss) • The probability that Y=1 is 40% • People are generally risk seeking • Students who hold executive positions are more likely to be risk averse • Students who join extracurricular activities are more likely to be risk averse, except for artist and USG • As students fail more, they tend to be more risk averse • Those with high CGPA are more likely to be risk averse • Male are more likely to be risk seeking • Those who are single are more likely to be risk seeking • As years goes by, students tend to be more risk averse.
Marginal effects after logit y = Pr(consistent) (predict) = .52562264 ------------------------------------------------------------------------------ variable | dy/dx Std. Err. z P>|z| [ 95% C.I. ] X ---------+-------------------------------------------------------------------- exec | .3730161 .12941 2.88 0.004 .119371 .626661 .663043 fail | .0358207 .03302 1.08 0.278 -.028895 .100536 1.6087 athlete*| .0280015 .36085 0.08 0.938 -.679243 .735246 .032609 artist*| -.2250507 .18023 -1.25 0.212 -.578298 .128196 .152174 usg*| .044608 .17934 0.25 0.804 -.306896 .396112 .271739 cso*| -.2324146 .17627 -1.32 0.187 -.57789 .113061 .25 spo*| -.5361031 .08375 -6.40 0.000 -.700252 -.371954 .021739 socioc~c*| .0739209 .37881 0.20 0.845 -.668541 .816383 .032609 ccs*| -.499848 .14871 -3.36 0.001 -.791314 -.208382 .097826 ced*| -.1732109 .30073 -0.58 0.565 -.762635 .416213 .065217 cla*| .2093161 .22181 0.94 0.345 -.225427 .644059 .097826 cob*| .1850299 .15765 1.17 0.241 -.123952 .494012 .315217 coe*| -.1390136 .22829 -0.61 0.543 -.58645 .308423 .184783 cgpa | -.0423288 .26124 -0.16 0.871 -.554357 .469699 2.72109 male*| -.049474 .13446 -0.37 0.713 -.313013 .214065 .532609 single*| .1908496 .15783 1.21 0.227 -.118498 .500197 .782609 year | .0867046 .08319 1.04 0.297 -.076344 .249754 2.83696 ------------------------------------------------------------------------------ (*) dy/dx is for discrete change of dummy variable from 0 to 1
Interpretation • The probability that Y=1 is 53% • People are generally consistent with their choice • Students who hold executive positions are more likely to be consistent • Students who join extracurricular activities are more susceptible to framing except for athletes, USG and Sociocivic • As students fail more, they tend to be more consistent with their choices • Those with high CGPA are more susceptible to framing effects • Male are more susceptible to framing effects • Those who are single are more consistent • As years goes by, students tend to be more consistent
Marginal effects after logit y = Pr(prospect) (predict) = .26369969 ------------------------------------------------------------------------------ variable | dy/dx Std. Err. z P>|z| [ 95% C.I. ] X ---------+-------------------------------------------------------------------- exec | -.2359319 .09243 -2.55 0.011 -.417097 -.054767 .663043 fail | -.0488731 .03214 -1.52 0.128 -.111874 .014128 1.6087 athlete*| -.0563669 .25374 -0.22 0.824 -.553689 .440956 .032609 artist*| .2021112 .18948 1.07 0.286 -.16927 .573492 .152174 usg*| .1966301 .1708 1.15 0.250 -.138132 .531392 .271739 cso*| .1227877 .17273 0.71 0.477 -.215751 .461326 .25 spo*| .7531349 .06625 11.37 0.000 .623284 .882986 .021739 socioc~c*| -.0049045 .31065 -0.02 0.987 -.613759 .60395 .032609 ccs*| .2651556 .2909 0.91 0.362 -.304995 .835306 .097826 ced*| .4887275 .2608 1.87 0.061 -.022428 .999883 .065217 cla*| -.0028899 .20605 -0.01 0.989 -.406749 .400969 .097826 cob*| -.0473009 .13834 -0.34 0.732 -.318437 .223835 .315217 coe*| .0093687 .1866 0.05 0.960 -.356364 .375101 .184783 cgpa | -.2644698 .21933 -1.21 0.228 -.694354 .165414 2.72109 male*| .1048044 .11102 0.94 0.345 -.112782 .322391 .532609 single*| .147567 .10751 1.37 0.170 -.063146 .35828 .782609 year | -.0389002 .06514 -0.60 0.550 -.166576 .088776 2.83696 ------------------------------------------------------------------------------ (*) dy/dx is for discrete change of dummy variable from 0 to 1
Interpretation • The prospect theory generally doesn’t hold true • Students who hold executive positions are more inclined to follow the theory • Students who join extracurricular activities are more inclined to follow the theory except for athletes and Sociocivic • As students fail more, they tend to disagree with the prospect theory • Those with high CGPA tend to disagree with the prospect theory • Male are more inclined to follow the theory • Those who are single are more inclined to follow the theory • As years goes by, students tend to disagree with the prospect theory