Download
1 / 60
610 likes | 752 Vues
Characterizing, measuring and visualizing forest resources. An inadequate treatment by an unqualified presenter. Things in this talk. Remote Sensing 001 Ways We’re Measuring Forests at UConn Quick Note on Visualization. Geospatial Technologies. Geographic Information Systems (GIS)

E N D
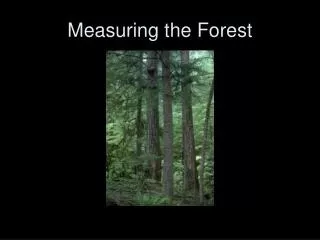
Characterizing, measuring and visualizing forest resources An inadequate treatment by an unqualified presenter.
Things in this talk • Remote Sensing 001 • Ways We’re Measuring Forests at UConn • Quick Note on Visualization
Geospatial Technologies • Geographic Information Systems (GIS) • Remote Sensing (RS) • Global Positioning Systems (GPS) • Internet
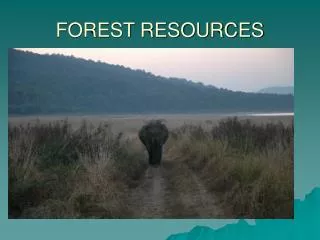
And since we’re talking forest rather than trees… Remote sensing is the art and science of detecting, identifying, classifying, and analyzing the earth’s surface using special sensors onboard airplanes and satellites.
Landscape Features Reflect Light Differently Value Value Band Band
Examples of RS Data Imagery Land Cover Elevation
General reference/Base mapping Visual background to other data Digitize new data Update existing data RS Imagery
21% developed 39% forest 16% wetland What is land cover? RS image Land cover map
Land Cover vs Land Use • Land Cover: Literally, what is covering the land (forest, wetland, pavement) • Land Use: What is planned, practiced or permitted on a given area (commercial, residential, dedicated open space)
Things in this talk • Remote Sensing 001 • Ways We’re Measuring Forests at UConn • Quick Note on Visualization
Analysis & Characterization • Forest cover maps • Forest block maps • Forest fragmentation analysis • Distance from a road analysis • Buffer analysis
Wetland 4% Other2% Water 3% Developed19% Turf/Grass4% Forest 56% Grasses/Ag 12% 2002 Land cover
(and water) 2002 Land cover: forest only
2002 Forest Cover: by town Town of Coventry: 67% forested
2002 Forest Cover: by county Tolland County: 68% forested
2002 Forest Cover: by watershed Willimantic Regional Basin: 73% forested
Forest Cover: Advantages • Easy to understand • Total cover relates to watershed research, possible watershed plan goals • Can easily fit into “Basic NEMO” educational approach
Analysis & Characterization • Forest cover maps • Forest block maps • Forest fragmentation analysis • Distance from a road analysis • Buffer analysis
Forest Block Analysis • Isolate forest cover • Remove any polygons smaller than the size of interest • Block size is keyfor birds and others • Considerable evidence that powerline corridors and roads reduce the quality of habitat for many species of forest birds in the surrounding habitat • Powerlines appear to be a conduit that brings predators and cowbirds deep into the forest interior
Forest Blocks – by Town Town of Coventry
Forest Blocks – by County Tolland County
Forest Blocks – by Watershed Willimantic Regional Basin
Forest Block: Advantages • Easy to generate once you have cover data • Relates well to specific habitat concerns • Allows the important distinction between amount of forest and amount of usable forest for wildlife
Analysis & Characterization • Forest cover maps • Forest block maps • Forest fragmentation analysis • Distance from a road analysis • Buffer analysis
UConn CLEAR FF Analysis • Original method developed by Riitters et al. (2000) of the USDA/USFS to assess global forest fragmentation from 1 km land cover data. • Adapted by CLEAR for use on Landsat-derived land cover information (30-meter spatial resolution).
Non-Forest Pixel Forest Pixel Pixel-by-pixel analysis A moving analysis window (9x9 is shown) is used to look at each center pixel in relation to all the surrounding pixels.
Forest Classes • Core Forest - all surrounding grid cells are forest. • Perforated Forest - the interior edge of a forest tract such as would occur around a small clearing or house lot. • Edge Forest - grid cell is on the exterior edge of a forest tract such as would occur along a large agricultural field or urban area. • Transitional Forest - about half of the surrounding grid cells are forest. • Patch Forest - less than 40% of surrounding grid cells are forest.
Forest Classes • Core Forest - all surrounding grid cells are forest. • Perforated Forest - the interior edge of a forest tract such as would occur around a small clearing or house lot. • Edge Forest - grid cell is on the exterior edge of a forest tract such as would occur along a large agricultural field or urban area. • Transitional Forest - about half of the surrounding grid cells are forest. • Patch Forest - less than 40% of surrounding grid cells are forest.
Forest Classes • Core Forest - all surrounding grid cells are forest. • Perforated Forest - the interior edge of a forest tract such as would occur around a small clearing or house lot. • Edge Forest - grid cell is on the exterior edge of a forest tract such as would occur along a large agricultural field or urban area. • Transitional Forest - about half of the surrounding grid cells are forest. • Patch Forest - less than 40% of surrounding grid cells are forest.
Forest Classes • Core Forest - all surrounding grid cells are forest. • Perforated Forest - the interior edge of a forest tract such as would occur around a small clearing or house lot. • Edge Forest - grid cell is on the exterior edge of a forest tract such as would occur along a large agricultural field or urban area. • Transitional Forest - about half of the surrounding grid cells are forest. • Patch Forest - less than 40% of surrounding grid cells are forest.
Forest Classes • Core Forest - all surrounding grid cells are forest. • Perforated Forest - the interior edge of a forest tract such as would occur around a small clearing or house lot. • Edge Forest - grid cell is on the exterior edge of a forest tract such as would occur along a large agricultural field or urban area. • Transitional Forest - about half of the surrounding grid cells are forest. • Patch Forest - less than 40% of surrounding grid cells are forest.
Forest Cover Map 2002 Forested area: 1,886,426 acres = 59.3% of CT
Forest Fragmentation Map ( 9x9 analysis window ) 2002 Core Forest: 576,764 acres = 18.1% of CT
Forest Frag: Advantages • Provide data about quality as well as quantity of forest • Can be run at different scales/grid sizes depending on concerns • Tells you something about pattern of the forested landscape and its suitability for habitat
Forest Cover • all based on the same input data (land cover) • best use(s) for each??? Forest Cover Forest Blocks Forest Fragmentation
Analysis & Characterization • Forest cover maps • Forest block maps • Forest fragmentation analysis • Distance from a road analysis • Buffer analysis
Distance of Forest From Roads 100 feet A nationwide study by Foreman (2000) estimates that 22% of total land area is affected ecologically by roads (within 100m of roads). 5400 feet
Analysis & Characterization • Forest cover maps • Forest block maps • Forest fragmentation analysis • Distance from a road analysis • Buffer analysis
Land Cover Within Buffers 100 ft 200 ft 300 ft
What we measured “Natural Vegetation”
25 Basins with greatest Natural Vegetation loss (percent) 1985-2002
Combined Indicators of Stream Health After Goetz et al., 2003