Download
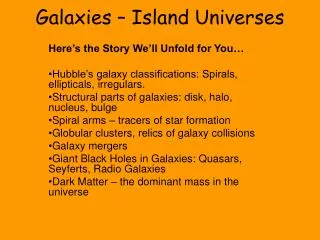
1 / 13
160 likes | 348 Vues
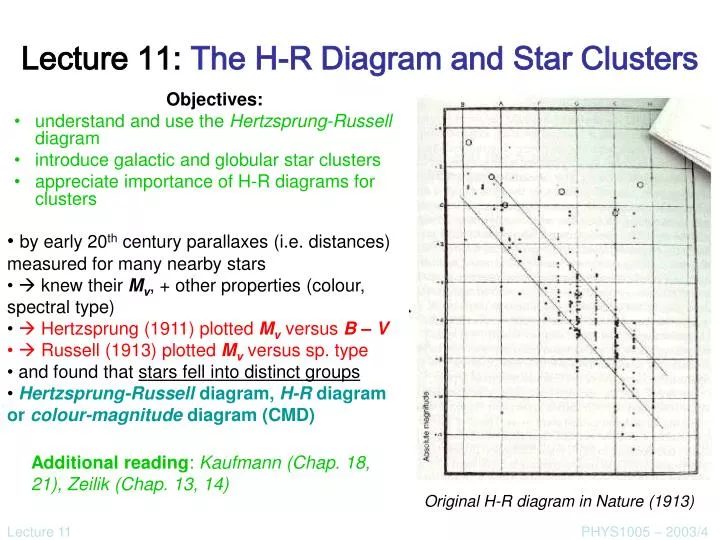
Lecture 11: The H-R Diagram and Star Clusters. by early 20 th century parallaxes (i.e. distances) measured for many nearby stars knew their M v , + other properties (colour, spectral type) Hertzsprung (1911) plotted M v versus B – V Russell (1913) plotted M v versus sp. type

E N D
Lecture 11: The H-R Diagram and Star Clusters • by early 20th century parallaxes (i.e. distances) measured for many nearby stars • knew their Mv, + other properties (colour, spectral type) • Hertzsprung (1911) plotted Mv versus B – V • Russell (1913) plotted Mv versus sp. type • and found that stars fell into distinct groups • Hertzsprung-Russell diagram, H-R diagram or colour-magnitude diagram (CMD) Objectives: understand and use the Hertzsprung-Russell diagram introduce galactic and globular star clusters appreciate importance of H-R diagrams for clusters Additional reading: Kaufmann (Chap. 18, 21), Zeilik (Chap. 13, 14) Original H-R diagram in Nature (1913) PHYS1005 – 2003/4
H-R Diagram for Nearby Stars: and going further out: PHYS1005 – 2003/4
Hipparcos H-R Diagram • most accurate parallaxes and hence Mv for 18,000 stars • V < 8 – 12 • d < 100 pc • Mv L • B – V , sp type T • i.e. H-R diagrams are really L vs T • i.e. Mv vs B – V is log L vs – log T • N.B. Sun has Mv = +4.8, B – V = +0.65 PHYS1005 – 2003/4
Physical implication of H-R diagrams: • tight correlation physical relation between L, T • recall stars as black-bodies:- L = 4 π R2σ T4 • log L = 4 log T + 2 log R + c • for constant R expect lines of negative gradient • main groupings identified: • 1) MAIN SEQUENCE • lower right (cool, dim) to upper left (hot, bright) – including Sun • R = 0.1 – 10 RO • 2) RED GIANTS • upper right • cool, bright, large • R = 10 – 1000 RO • 3) WHITE DWARFS • lower left • hot, dim, small • R ≈ 0.01 RO PHYS1005 – 2003/4
Representation in H-R diagrams: • number of stars in Hipparcos H-R diagrams is misleading • assume to be plotted, require V < 8, d < 100 pc • stars with Mv < +3 have V < 8 at 100 pc – fully represented • but stars with Mv = +8 have V = 8 at d = 10pc are undercounted by factor 1000 • white dwarfs have Mv = +12 are very under-represented • example of a selection effect Star Clusters: • in general, stars have different ages, abundances and distances • but stars in clusters have the same: • distance • age • element abundances • basically two types of clusters: • Open or Galactic clusters • Globular clusters PHYS1005 – 2003/4
Open (Galactic) Clusters: • key facts: • groups of 100 – 1000 stars • only in disk of Galaxy (where Sun is) • ages vary from v young (< few Myrs) to v old (several Gyrs) • ~1000 known, many hidden by extinction • Pleiades, Hyades easily visible open clusters Pleiades h and χ Per PHYS1005 – 2003/4
Hyades PHYS1005 – 2003/4
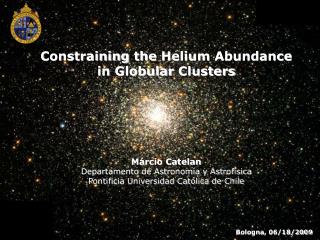
Globular Clusters: • key facts: • spherical groups of 105 – 106 stars, 20 – 50 pc across • core density 102 – 104 stars pc-3 (cf. ~1 near Sun) • distributed spherically around centre of Galaxy, not just in disc • all very old (>1010 yrs, comparable to Universe) • about 150 in Galaxy M55 M15 PHYS1005 – 2003/4
Globular clusters are distributed spherically around our Galaxy M80 PHYS1005 – 2003/4
Cluster H-R diagrams: Schematic cluster H-R diagram • stars in cluster all at same d mV vs B – V almost as good as MV • key facts: • as clusters age: • brightest M-S stars disappear • M-S turn-off point gets fainter with age • very young clusters have no very dim M-S stars • in young to middle-aged clusters (<2 Gyrs): • giants are separated from M-S by “Hertzsprung Gap” • old clusters have no Hertzsprung Gap, and • giants extend 6 – 7 mags above M-S • globular clusters have additional features: • horizontal branch • asymptopic giant branch (AGB) • these are all observed features • to explain them, need to understand how stars evolve PHYS1005 – 2003/4
Open Cluster H-R Diagrams PHYS1005 – 2003/4