Download
1 / 21
210 likes | 217 Vues
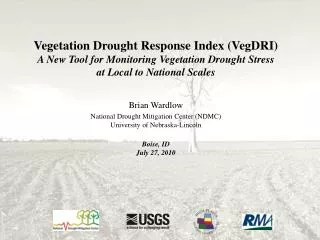
Drought Monitoring—How It’s Done, How Well Does it Work, and What is Needed. Douglas Le Comte NOAA/CPC 33rd Annual Climate Diagnostics and Prediction Workshop October 20-24, 2008 Douglas.lecomte@noaa.gov. How It’s Done. It IS important to put drought in terms the laymen can understand!.

E N D
Drought Monitoring—How It’s Done, How Well Does it Work, and What is Needed Douglas Le Comte NOAA/CPC 33rd Annual Climate Diagnostics and Prediction Workshop October 20-24, 2008 Douglas.lecomte@noaa.gov
How It’s Done It IS important to put drought in terms the laymen can understand!
Several Approaches • Direct Measurements a) Reservoir storage b) Streamflows c) Soil moisture (e.g. SCAN) d) Groundwater 2)Drought Indices a) Palmer Drought Index b) SPI c) SWSI 3) Remote Sensing 4)Modeling a) LDAS Soil Moisture and Runoff b) CPC Leaky Bucket 5)Impacts (Mostly subjective) 6)Combinations of the Above (U.S. Drought Monitor) Real-time reservoir storage Real-time streamflows
White House Drought Briefing August 11, 1999 East Coast drought in the summer of 1999 spurred rapid transition of the experimental Drought Monitor to operational status. Commerce Secretary Daley
Before the Drought Monitor In the old days, the Palmer Drought Index was the main source of drought information… works fine in some parts of the country but not in others, and misses short-term drought.
The Challenge • No fixed drought definition, several drought types (hydro, ag, meteorological), and everyone has their own perception of what constitutes drought • On blending drought indicators: “There is no perfect blend, and no perfect depiction for a given point—only a range of possible depictions, any of which might be argued as equally valid, and all of which will contain inaccuracies that can be validly argued.” (Rich Tinker, April 20, 2005)
The Drought Monitor Concept • A consolidation of indices and indicators into one comprehensive national drought map • Trying to capture these characteristics: • the drought’s magnitude (duration + intensity) • spatial extent • probability of occurrence • Impacts • Rates drought intensity by percentile ranks
Drought Severity Classifications The original intent of the DM was to base the depiction on the consensus of 5 or 6 key indicators.
U.S. Drought Monitor • Integrates Key • Drought Indicators: • - Palmer Drought Index • - SPI • - KBDI • Modeled Soil Moisture • - 7-Day Avg. Streamflow • - Precipitation Anomalies • Growing Season: • - Crop Moisture Index • - Sat. Veg. Health Index • Soil Moisture • Mesonet data • In The West: • - SWSI • - Reservoir levels • Snowpack • Streamflow • Created in ArcGIS
The Importance of Local Expert Input • The U.S. Drought Monitor Team Relies on Field Observation Feedback from the Local Experts for Impacts Information & “Ground Truth” • List server (230 Participants: 2/3 Federal, 1/3 State/Univ.) Local NWS & USDA/NRCS Offices State Climate Offices State Drought Task Forces Regional Climate Centers Much of this feedback is subjective and can be inconsistent with drought indices
Drought Indicators vs Local Input When local suggestions run counter to the preponderance of the drought data/evidence, the DM author can be put in an impossible (no win) situation. Drought Monitor author The USDM process has been labeled “a negotiated settlement”
“Drought intensity categories are based on five key indicators and numerous supplementary indicators... the final drought category tends to be based on what the majority of the indicators show. DM authors often don’t follow the indicators, and each weights and interprets them differently. There is no way to make the advisors (WFOs, SC’s, etc.) conform to any set of indicators, and the DM author is often reluctant to oppose their advice. 9 DM authors among 5 agencies are on a rotating schedule. Pro: fresh perspectives. Con: inconsistencies. Pro: Ground truth/impacts are considered. Con: Difficult to quantify. Pros and Cons of the DM Methodology Attempt to be Objective But …
What is Needed • A consistent, objective Drought Monitor based on a synthesis of the indicators, tweaked to reflect ground truth • More accurate indicators, including more soil measurements • Continued progress on combining soil model output • Continued progress on satellite monitoring
LDAS Ensemble Soil Moisture Combines Mosaic, Noah, SAC Combines VIC, SAC, Noah, CLM Need to consolidate all ensemble soil models
Soil Climate Analysis Network (SCAN) http://www.wcc.nrcs.usda.gov/scan/ Soil measurements are underutilized Need to map this data We have about 100 real-time sites. Can use many more.
Private Sector Drought/Soil Monitoring AccuWeather Oct. 17 Oct. 15 Topsoil Moisture Weather Derivatives
Satellite Comparisons LDAS Precipitation LDAS Soil Moisture Change (top 10 cm) QSCAT Soil Moisture Change (top 5 cm) AMSR Soil Moisture Change (surface) Nghiem et al., 2008
Improved Drought Forecasting CPC working with partners to provide objective, probabilistic drought forecasts