Download
1 / 22
220 likes | 308 Vues
Explore different depreciation methods like MACRS and GDS with tax implications. Learn to analyze after-tax cash flows effectively.

E N D
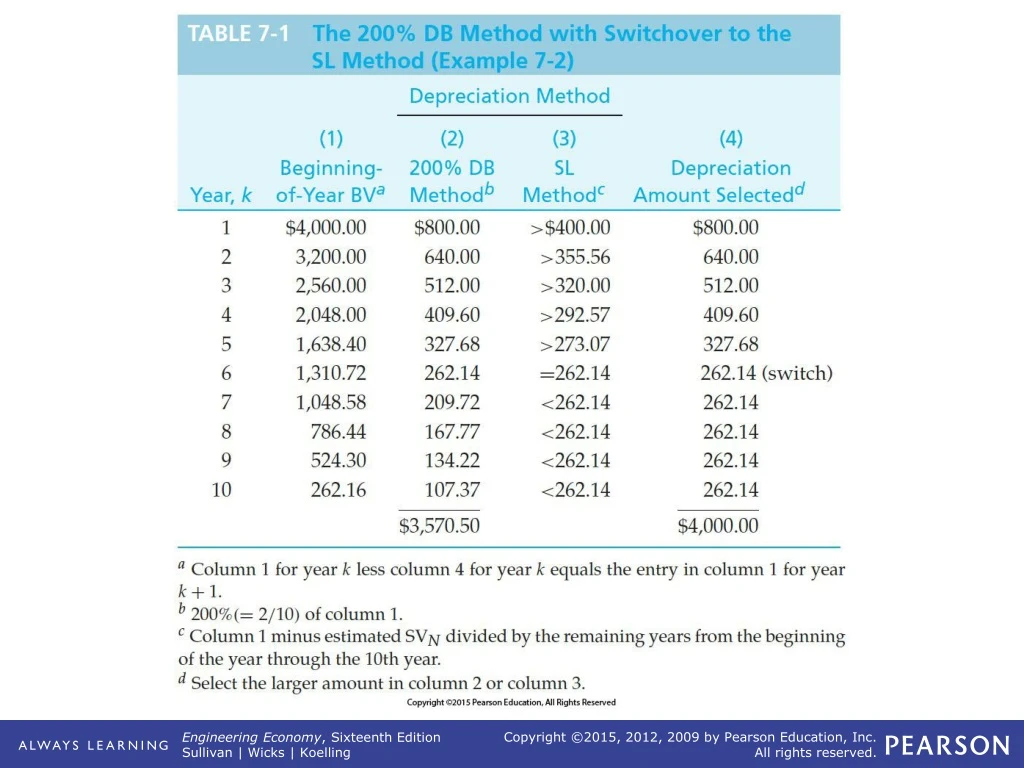
TABLE 7-1 The 200% DB Method with Switchover to the SL Method (Example 7-2)
TABLE 7-2 (continued) MACRS Class Lives and Recovery Periodsa
TABLE 7-3 GDS Recovery Rates (rk) for the Six Personal Property Classes
TABLE 7-3 GDS (continued) Recovery Rates (rk) for the Six Personal Property Classes
Figure 7-1 Flow Diagram for Computing Depreciation Deductions under MACRS
TABLE 7-4 MACRS (GDS) Property Classes and Primary Methods for Calculating Depreciation Deductions
TABLE 7-4 (continued) MACRS (GDS) Property Classes and Primary Methods for Calculating Depreciation Deductions
Figure 7-2 GDS Recovery Rate for 5-year Recovery Period Spreadsheet
Figure 7-3 BV Comparisons for Selected Methods of Depreciation in Example 7-7 (Note: The bus is assumed to be sold in year six for the MACRS-GDS method.)
Figure 7-4 The Federal Income Tax Rates for Corporations (Table 7-5) with Incremental Income Tax for a Proposed Project (assumes, in this case, corporate taxable income without project > $18,333,333)
Figure 7-5 General Format (Worksheet) for After-Tax Analysis; Determining the ATCF
TABLE 7-7 ATCF Analysis of Example 7-16 [Reworked Example 7-15 with Machinery in the 10-Year MACRS (GDS) Property Class]
TABLE 7-9 After-Tax Analysis of Purchase Alternative (Example 7-19)


